Sheep Numbers By State
Northern Territory
Western Australia
Sheep Numbers Shorn
| million | NSW | VIC | WA | SA | TAS | QLD | TOTAL |
| 2022/23 | 25.9 | 16.1 | 13.0 | 11.1 | 2.6 | 2.8 | 71.5 |
| 2023/24 | 26.6 | 15.6 | 12.5 | 11.4 | 2.8 | 2.7 | 71.6 |
| 2024/25* | 24.2 | 13.7 | 10.1 | 9.9 | 2.6 | 2.5 | 63.0 |
Source: Australian Wool Production Forecasting Committee August 2025
*Forecast
Shorn Wool Production
| mkg# | NSW | VIC | WA | SA | TAS | QLD | TOTAL |
| 2022/23 | 119.0 | 70.0 | 60.6 | 56.7 | 10.2 | 11.3 | 328 |
| 2023/24 | 119.5 | 65.6 | 55.0 | 58.0 | 9.3 | 10.0 | 318 |
| 2024/25* | 110.0 | 59.5 | 44.9 | 47.3 | 9.2 | 9.2 | 280.1 |
Source: Australian Wool Production Forecasting Committee August 2025
#million kilograms *Forecast
AWI In Your State: WA
A 4-page document that highlights key AWI on-farm results/resources in Western Australia. There are separate versions available for each state.
New South Wales
Sheep Numbers Shorn
| million | NSW | VIC | WA | SA | TAS | QLD | TOTAL |
| 2022/23 | 25.9 | 16.1 | 13.0 | 11.1 | 2.6 | 2.8 | 71.5 |
| 2023/24 | 26.6 | 15.6 | 12.5 | 11.4 | 2.8 | 2.7 | 71.6 |
| 2024/25* | 24.2 | 13.7 | 10.1 | 9.9 | 2.6 | 2.5 | 63.0 |
Source: Australian Wool Production Forecasting Committee August 2025
*Forecast
Shorn Wool Production
| mkg# | NSW | VIC | WA | SA | TAS | QLD | TOTAL |
| 2022/23 | 119.0 | 70.0 | 60.6 | 56.7 | 10.2 | 11.3 | 328 |
| 2023/24 | 119.5 | 65.6 | 55.0 | 58.0 | 9.3 | 10.0 | 318 |
| 2024/25* | 110.0 | 59.5 | 44.9 | 47.3 | 9.2 | 9.2 | 280.1 |
Source: Australian Wool Production Forecasting Committee August 2025
#million kilograms *Forecast
AWI In Your State: NSW
A 4-page document that highlights key AWI on-farm results/resources in NSW. There are separate versions available for each state.
Victoria
Sheep Numbers Shorn
| million | NSW | VIC | WA | SA | TAS | QLD | TOTAL |
| 2022/23 | 25.9 | 16.1 | 13.0 | 11.1 | 2.6 | 2.8 | 71.5 |
| 2023/24 | 26.6 | 15.6 | 12.5 | 11.4 | 2.8 | 2.7 | 71.6 |
| 2024/25* | 24.2 | 13.7 | 10.1 | 9.9 | 2.6 | 2.5 | 63.0 |
Source: Australian Wool Production Forecasting Committee August 2025
*Forecast
Shorn Wool Production
| mkg# | NSW | VIC | WA | SA | TAS | QLD | TOTAL |
| 2022/23 | 119.0 | 70.0 | 60.6 | 56.7 | 10.2 | 11.3 | 328 |
| 2023/24 | 119.5 | 65.6 | 55.0 | 58.0 | 9.3 | 10.0 | 318 |
| 2024/25* | 110.0 | 59.5 | 44.9 | 47.3 | 9.2 | 9.2 | 280.1 |
Source: Australian Wool Production Forecasting Committee August 2025
#million kilograms *Forecast
AWI In Your State: VIC
A 4-page document that highlights key AWI on-farm results/resources in Victoria. There are separate versions available for each state.
Queensland
Sheep Numbers Shorn
| million | NSW | VIC | WA | SA | TAS | QLD | TOTAL |
| 2022/23 | 25.9 | 16.1 | 13.0 | 11.1 | 2.6 | 2.8 | 71.5 |
| 2023/24 | 26.6 | 15.6 | 12.5 | 11.4 | 2.8 | 2.7 | 71.6 |
| 2024/25* | 24.2 | 13.7 | 10.1 | 9.9 | 2.6 | 2.5 | 63.0 |
Source: Australian Wool Production Forecasting Committee August 2025
Shorn Wool Production
| mkg# | NSW | VIC | WA | SA | TAS | QLD | TOTAL |
| 2022/23 | 119.0 | 70.0 | 60.6 | 56.7 | 10.2 | 11.3 | 328 |
| 2023/24 | 119.5 | 65.6 | 55.0 | 58.0 | 9.3 | 10.0 | 318 |
| 2024/25* | 110.0 | 59.5 | 44.9 | 47.3 | 9.2 | 9.2 | 280.1 |
Source: Australian Wool Production Forecasting Committee August 2025
#million kilograms *Forecast
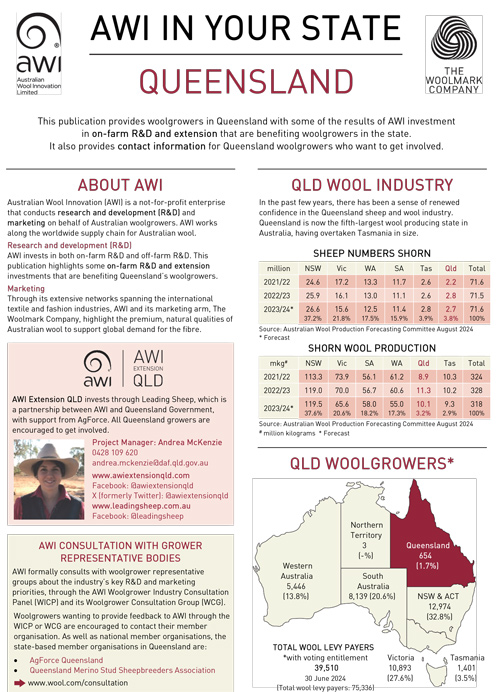
AWI In Your State: QLD
A 4-page document that highlights key AWI on-farm results/resources in Queensland. There are separate versions available for each state.
South Australia
Sheep Numbers Shorn
| million | NSW | VIC | WA | SA | TAS | QLD | TOTAL |
| 2022/23 | 25.9 | 16.1 | 13.0 | 11.1 | 2.6 | 2.8 | 71.5 |
| 2023/24 | 26.6 | 15.6 | 12.5 | 11.4 | 2.8 | 2.7 | 71.6 |
| 2024/25* | 24.2 | 13.7 | 10.1 | 9.9 | 2.6 | 2.5 | 63.0 |
Source: Australian Wool Production Forecasting Committee August 2025
*Forecast
Shorn Wool Production
| mkg# | NSW | VIC | WA | SA | TAS | QLD | TOTAL |
| 2022/23 | 119.0 | 70.0 | 60.6 | 56.7 | 10.2 | 11.3 | 328 |
| 2023/24 | 119.5 | 65.6 | 55.0 | 58.0 | 9.3 | 10.0 | 318 |
| 2024/25* | 110.0 | 59.5 | 44.9 | 47.3 | 9.2 | 9.2 | 280.1 |
Source: Australian Wool Production Forecasting Committee August 2025
#million kilograms *Forecast
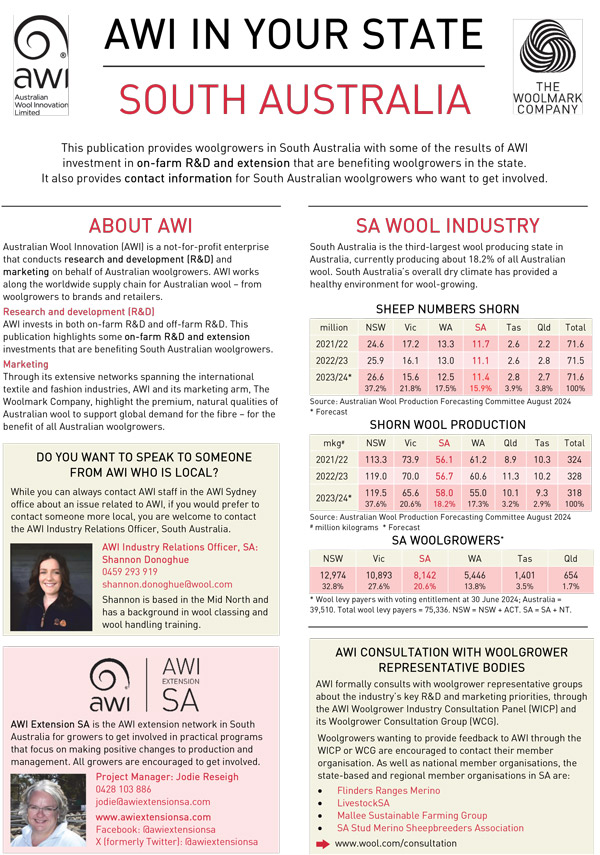
AWI In Your State: SA
A 4-page document that highlights key AWI on-farm results/resources in South Australia. There are separate versions available for each state.
Tasmania
Sheep Numbers Shorn
| million | NSW | VIC | WA | SA | TAS | QLD | TOTAL |
| 2022/23 | 25.9 | 16.1 | 13.0 | 11.1 | 2.6 | 2.8 | 71.5 |
| 2023/24 | 26.6 | 15.6 | 12.5 | 11.4 | 2.8 | 2.7 | 71.6 |
| 2024/25* | 24.2 | 13.7 | 10.1 | 9.9 | 2.6 | 2.5 | 63.0 |
Source: Australian Wool Production Forecasting Committee December 2024
*Forecast
Shorn Wool Production
| mkg# | NSW | VIC | WA | SA | TAS | QLD | TOTAL |
| 2022/23 | 119.0 | 70.0 | 60.6 | 56.7 | 10.2 | 11.3 | 328 |
| 2023/24 | 119.5 | 65.6 | 55.0 | 58.0 | 9.3 | 10.0 | 318 |
| 2024/25* | 110.0 | 59.5 | 44.9 | 47.3 | 9.2 | 9.2 | 280.1 |
Source: Australian Wool Production Forecasting Committee August 2025
#million kilograms *Forecast
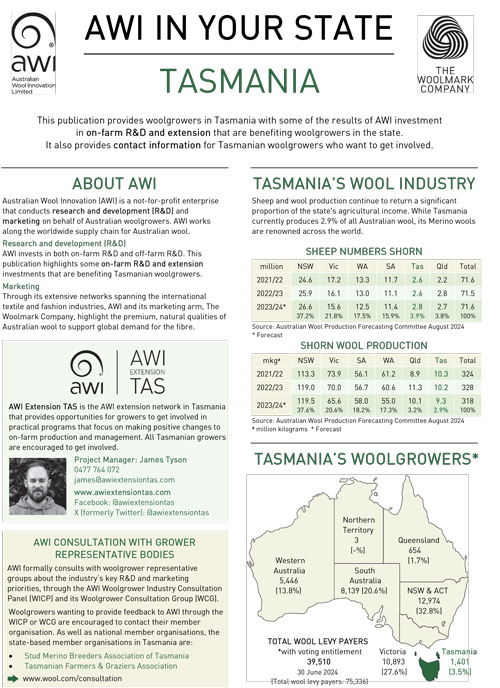
AWI In Your State: TAS
A 4-page document that highlights key AWI on-farm results/resources in Tasmania. There are separate versions available for each state.
Click the map to find out more about sheep and AWI in your state.
Data sourced from Australian Wool Production Forecast Report August 2025
| Year | Opening Sheep Number (million) |
Sheep Numbers Shorn (million) |
Average Cut Per Head (kg) |
Shorn Wool Production (mkg greasy) |
|---|---|---|---|---|
| 1991-92 | 163.1 | 180.9 | 4.43 | 801 |
| 1992-93 | 148.1 | 178.8 | 4.56 | 815 |
| 1993-94 | 138 | 172.8 | 4.49 | 775 |
| 1994-95 | 132.5 | 156.2 | 4.37 | 682 |
| 1995-96 | 120.8 | 145.6 | 4.50 | 655 |
| 1996-97 | 121 | 152 | 4.35 | 661 |
| 1997-98 | 120.1 | 150 | 4.22 | 633 |
| 1998-99 | 117.4 | 153.6 | 4.33 | 665 |
| 1999-00 | 115.4 | 144.2 | 4.30 | 619 |
| 2000-01 | 118.5 | 139.5 | 4.31 | 602 |
| 2001-02 | 110.8 | 118.6 | 4.68 | 555 |
| 2002-03 | 106.1 | 116.6 | 4.28 | 499 |
| 2003-04 | 99.2 | 104.7 | 4.53 | 475 |
| 2004-05 | 101.2 | 106 | 4.49 | 475 |
| 2005-06 | 101.1 | 106.5 | 4.33 | 461 |
| 2006-07 | 91 | 101.4 | 4.24 | 430 |
| 2007-08 | 85.7 | 90.2 | 4.43 | 400 |
| 2008-09 | 76.9 | 79.3 | 4.52 | 362 |
| 2009-10 | 72.7 | 76.2 | 4.50 | 343 |
| 2010-11 | 70.8 | 76.2 | 4.53 | 345 |
| 2011-12 | 73.1 | 76.4 | 4.48 | 342 |
| 2012-13 | 74.7 | 78.8 | 4.47 | 352 |
| 2013-14 | 75.5 | 78 | 4.37 | 341 |
| 2014-15 | 72.6 | 76.9 | 4.50 | 346 |
| 2015-16 | 70.9 | 73.4 | 4.43 | 325 |
| 2016/17 | 71.9 | 74.3 | 4.58 | 340 |
| 2017/18 | 74.7 | 76.8 | 4.45 | 341 |
| 2018/19 | 73.8 | 72.5 | 4.13 | 300 |
| 2019/20 | 68.7 | 68.6 | 4.13 | 284 |
| 2020/21 | 66.4 | 66.9 | 4.40 | 294 |
| 2021/22 | 66.7 | 69.0 | 4.54 | 314 |
| 2022/23 | 68.5 | 70.9 | 4.54 | 321 |
| 2024/25f | 65.9 | 67.3 | 4.55 | 306 |
| Parameter | 2022/23 Final Estimate |
2023/24 Final Estimate |
Change y-o-y (%) |
2024/25 Third Forecast |
Change y-o-y (%) |
| Sheep numbers shorn (million head) | 71.5 | 71.6 | 0.1% | 63.2 | -11.7% |
| Average cut per head (kg/head) | 4.59 | 4.44 | -3.3% | 4.42 | -0.5% |
|
Shorn wool production |
328 | 318 | -3.1% | 279 | -12.0% |
|
Latest AWPFC forecast in December 2024 |
|||||
Reports are based on AWI Wool Production Forecasting Committee, AWI and Meat & Livestock Australia (MLA) joint survey and statistical models.