Australian Wool Production Forecast Report August 2024

The Australian Wool Production Forecasting Committee’s (AWPFC) estimate of shorn wool production for the 2023/24 season is 318 million kilograms (Mkg) greasy. This is 3.1% lower than the 2022/23 estimate and a 6 Mkg greasy downward revision of the April forecast.
-
The Australian Wool Production Forecasting Committee’s (AWPFC) estimate of Australian shorn wool production for 2023/24 is 318 million kilograms (Mkg) greasy, 3.1% lower than the 2022/23 season estimate, and a 6 Mkg greasy downward revision of the April forecast. The deterioration in seasonal conditions in western Victoria, South Australia, Western Australia and southwest New South Wales since the April meeting prompted the downward revision.
-
Sheep shorn numbers were comparable to the 2022/23 season at 71.6 million head, up 0.1%. However, the relatively poorer seasonal conditions in 2023/24 reduced average cut per head to 4.44 kg greasy, down 3.3%. This is close to the long-term average following historically high per head production in 2022/23.
-
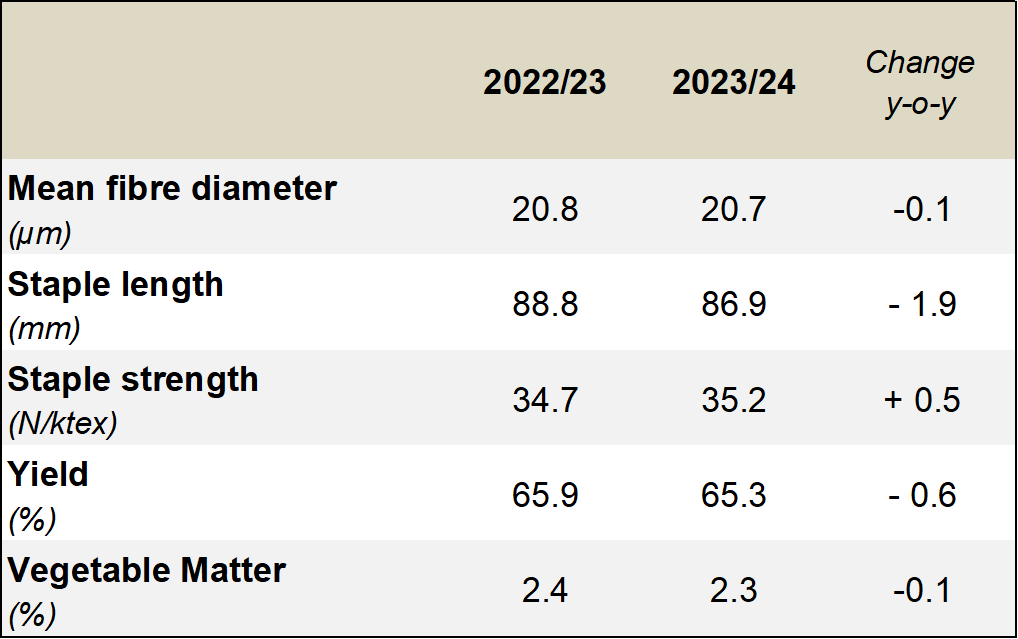
AWTA key test data for the 2023/24 season show a 0.1 micron decrease in mean fibre diameter to 20.7 microns, a 1.9 mm decrease in staple length to 86.9 mm, 0.6% lower yield to 65.3% and 0.1% less VM (2.3%). Staple strength increased to 35.2N/ktex (up 0.5 N/ktex). The weighted average fibre diameter of first-hand Merino wool auctioned in 2023/24 was 18.8 microns (down 0.2 microns on the 2022/23 season).
-
Held over lambs and older breeding ewes that were retained in the flock at the beginning of the 2023/24 season have now been turned off prompted an increase in sheepmeat prices in recent months. ABS sheep slaughter data for July 2023 to March 2024 were 24% higher compared with the same nine months during 2022/23 and lamb slaughter was up 22%. Total turnoff of sheep and lambs in the first nine months of the 2023/24 season was 21% higher than the same nine months of 2022/23 and 24% above the five-year average.
-
New South Wales continues to have the largest sheep flock, shearing 26.6 million head (up 2.7%) and producing 119.5 Mkg greasy wool (up 0.4%). Victoria shore 15.6 million sheep (down 3.1%) and produced 65.6 Mkg greasy (down 6.3%) with Western Australia producing 55.0 Mkg greasy (down 9.3%) from 12.5 million sheep shorn (down 4.2%). South Australia shore 11.4 million head (up 2.7%) and produced 58.0 Mkg greasy (up 2.3%). The number of sheep shorn in Tasmania (2.8 million head) and Queensland (2.7 million head) were similar (up 7.7% and down 3.6% respectively) with 9.3 Mkg greasy produced in Tasmania (down 8.8%) and 10.1 Mkg greasy in Queensland (down 10.6%).
-
AWTA wool test volume for the 2023/24 season (334.7 Mkg greasy) was down by 3.8% on a year-on-year basis. The volume of wool tested during 2023/24 increased in South Australia (up 4.8%) but decreased in all other states. Queensland’s wool test volume was down 16.0%, Western Australia down 7.3%, New South Wales down 4.4%, Victoria down 3.8% and Tasmania down 2.7%.
-
First-hand offered wool at auction during 2023/24 was not different to the amount offered in 2022/23 at 298 Mkg greasy. First-hand auction offerings increased in South Australia (up 7.5%), Tasmania (up 4.9%) and Western Australia (up 2.6%). First-hand auction offerings decreased in Victoria (down 7.5%), Queensland (down 3.9%) and New South Wales (down 0.5%).
-
Poor seasonal conditions in western Victoria, Tasmania, South Australia and Western Australia prompted the AWPFC to revise its second forecast of shorn wool production for the 2024/25 season down to 285 Mkg greasy, a 10.1% decrease on the 2023/24 estimate.
-
The May 2024 Sheep Producer Intentions Survey (SPIS) indicated a reduction in producer sentiment regarding both the wool and sheepmeat sectors compared to sentiment in May 2023. Seasonal conditions, feed availability, input costs, availability of labour as well as sheep and wool prices are the key factors impacting on-farm decision making.
-
The Bureau of Meteorology is forecasting average to above average median rainfall in Queensland, New South Wales, Victoria and Tasmania from September to November, but below average rainfall is expected in South Australia and Western Australia. Producers in most states will reassess their stocking rate if feed availability remains limiting in spring. On-farm stock water availability leading into summer is another key consideration. The AWPFC will review its 2024/25 forecast in December when the seasonal and market outlook becomes clearer.
-
The May 2024 Sheep Producer Intentions Survey (SPIS) indicated a reduction in producer sentiment regarding both the wool and sheepmeat sectors compared to sentiment in May 2023. Seasonal conditions, feed availability, input costs, availability of labour as well as sheep and wool prices are the key factors impacting on-farm decision making.
-
Table 1 summarises Australian wool production and Table 2 shows the total shorn wool production by state. The 2022/23 and 2023/24 estimates include a clean wool estimate for average cut per head and shorn wool production. For both seasons the yield (%, Schlumberger dry top and noil yield) from the AWTA key test data was used to calculate the clean average cut per head and clean shorn wool production.
-
Table 3 provides a comparison of AWTA key test data for the 2022/23 and 2023/24 seasons.
Table 1: Summary of Australian wool production
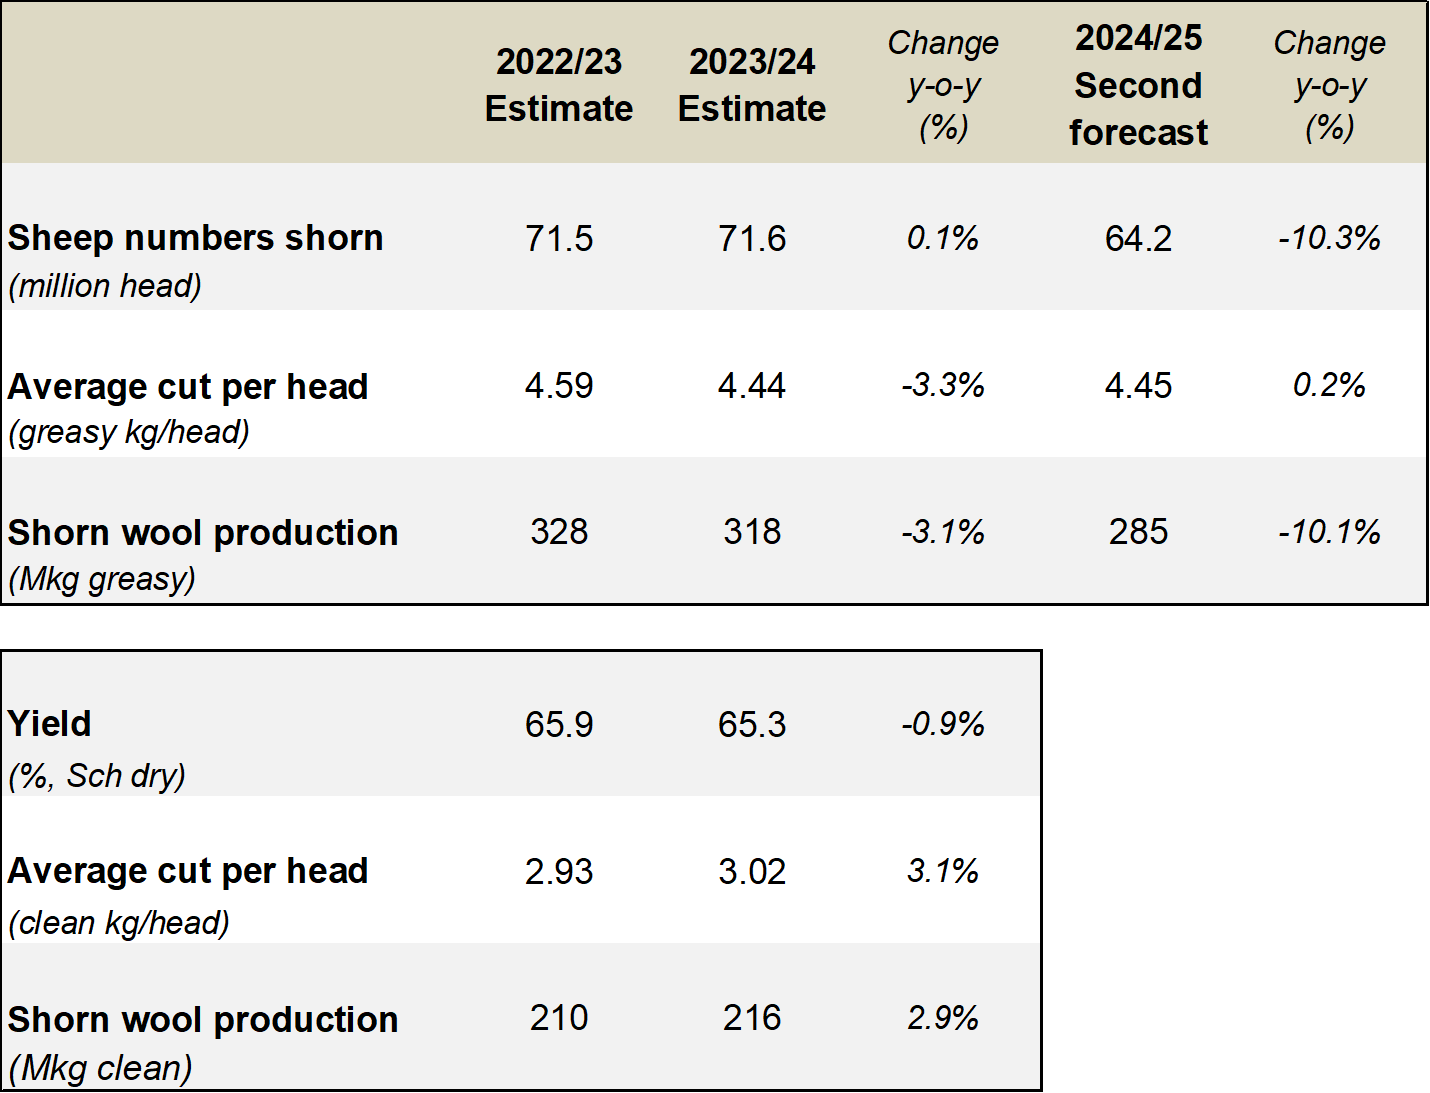
Table 2: Total shorn wool production by state
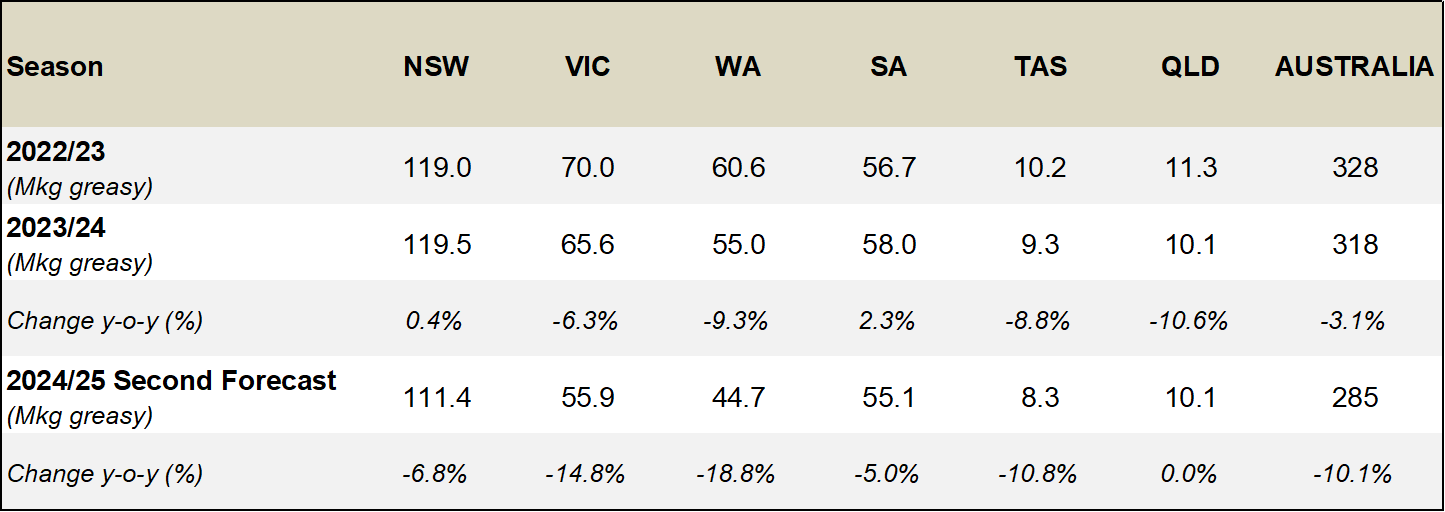
Table 3: AWTA key test data for 2022/23 and 2023/24 (July to March)
- More detailed information on the shorn wool production by state in 2023/24 can be found in Table A1 in the Appendix to this report.
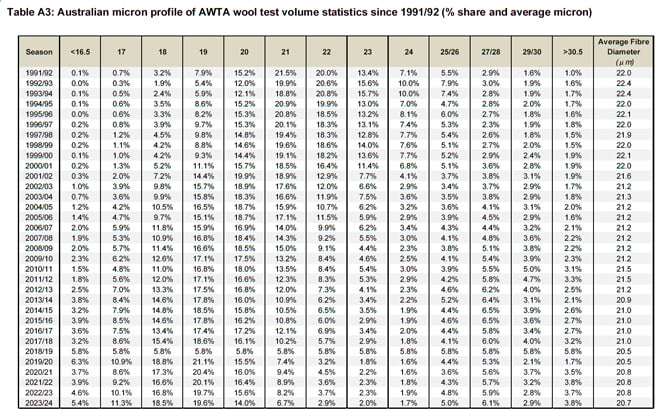
- The Appendix also provides historical data for Australia, including sheep shorn numbers, average cut per head and shorn wool production (Table A2) as well as the micron profile (Table A3) since 1991/92.
Detail on shorn wool production in 2023/24 and the 2024/25 forecast
Major data inputs
The AWPFC forecasts are based on detailed consideration by the state and national committees of data from various sources including:
- AWTA wool test data for the 2023/24 season and 2024/25 to July 2024;
- AWEX first-hand auction statistics for the 2023/24 season and 2024/25 to July 2024 (Week 4);
- ABS sheep and lamb turn-off for the 2023/24 season to March 2024;
- Information on current and expected seasonal conditions from the Bureau of Meteorology; and
- Survey information from the MLA/AWI Sheep Producer Intentions Survey conducted in May 2024.
AWTA wool test data
Every month AWTA releases data on the volumes of greasy wool tested within the various diameter categories for the month and the season to date. Data for the 2023/24 season are compared with previous seasons (2019/20 to 2022/23) in this report.
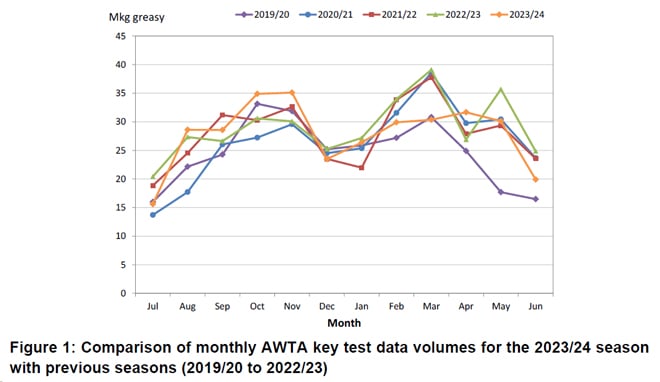
The month-by-month comparison of wool tested during the 2023/24 season showed test volumes in August, October, November and April at five-year highs (Figure 1). Test volumes for December 2023 and March 2024 were the lowest for the past 5 seasons. Volumes tested in January, February and May were mid-way between previous seasons, before dipping lower in June. Across all five seasons, monthly test volumes tend to increase from July to November, decrease in December and then increase from January to March before decreasing through to June.
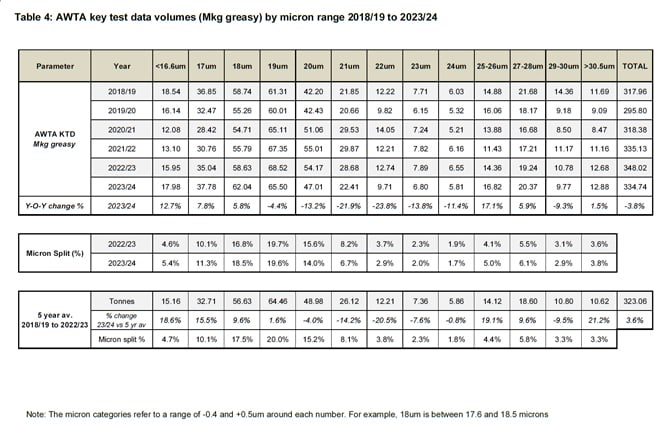
AWTA national wool test volumes data for the 2023/24 (Table 4) shows:
- Volumes of wool tested were 3.8% lower than the 2022/23 season at 334.7 Mkg greasy. This was 3.6% higher than the five-year average from 2018/19 to 2022/23. Note that the 2022/23 test volumes (348.0 Mkg greasy) were the highest for the past five seasons.
- There were increases in the weight of wool tested in less than 16.6 microns (up 12.7%), 17 microns (up 7.8%), 18 microns (up 5.8%), 25 -26 microns (up 17.1%), 27 – 28 microns (up 5.9%) and the greater than 30.5 microns (up 1.5%) categories. The weight of wool tested in all other micron categories decreased by between 4.4% (19 microns) and 23.8% (22 microns).
- The largest micron categories by volume were the 19-micron (65.5 Mkg greasy), 18-micron (62.0 Mkg greasy) and 20-micron (47.0 Mkg greasy) categories.
- The micron split (% of total weight of wool tested) during the 2023/24 season was similar to that tested during 2022/23. The difference across the micron categories ranged from +1.7% (18-micron) to -1.6% (20-micron).
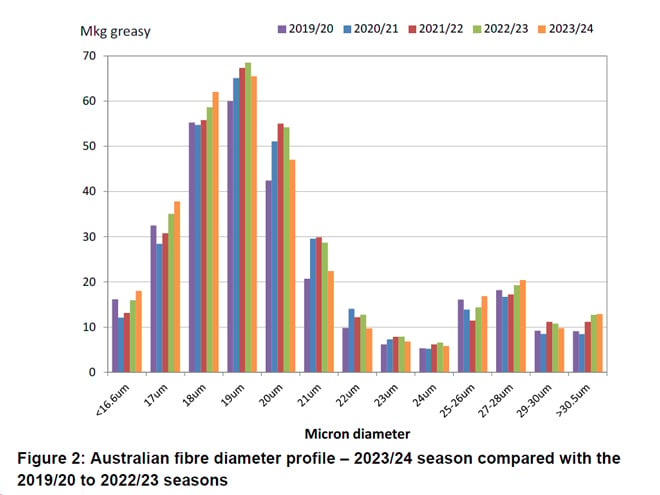
The micron profile of the Australian wool clip continues to have two distinct peaks; one centred around 19-micron wool (finer than 16.6 microns up to 23 microns) and a second centred around 27 - 28 microns (from 24 microns to 30.5 microns and broader) (Figure 2).
A historical comparison of the Australian wool clip’s micron profile percentage share and average micron can be found in Appendix Table A3 (at the end of this report).
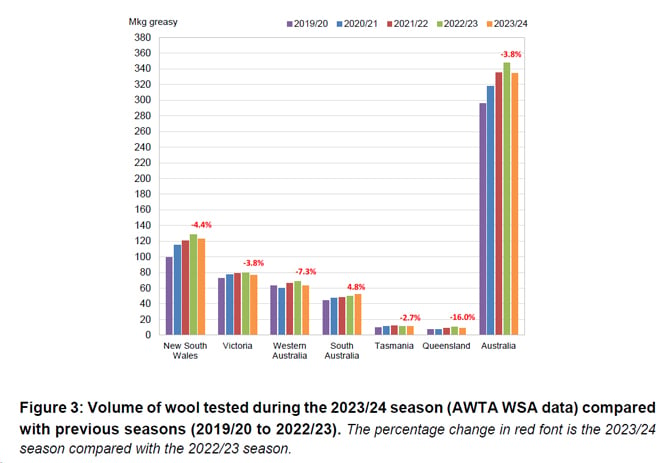
Based on data by Wool Statistical Area (WSA), the volumes of wool tested during 2023/24 decreased in all states except for South Australia (up 4.8%) (Figure 3). Queensland had the greatest decrease in the volume of wool tested (down 16.0%), followed by Western Australia (down 7.3%), New South Wales (down 4.4%), Victoria (down 3.8%) and Tasmania (down 2.7%).
In New South Wales, the greatest volumes of wool tested originated from WSA regions N23 (16.8%), N19 (7.1%), N29 (6.8%), N15 (5.6%) and N03 (5.2%) (Figure 4a). Collectively, these
five WSAs represented 41.5% of the total weight of wool tested in New South Wales during 2023/24 (Figure 4b).
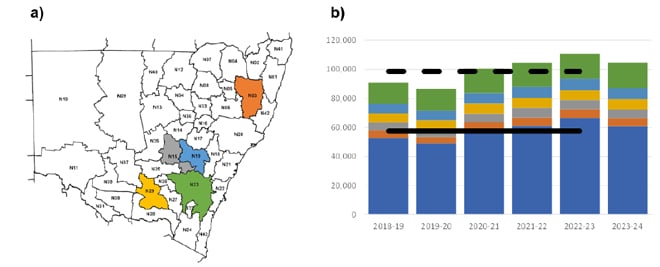
Figure 4: a) The five New South Wales WSA regions from which the greatest volumes of wool tested originated and b) The total wool test volumes for the 2023/24 season compared with previous seasons (2018/19 to 2022/23). The larger blue portion of each column represents the other WSA regions with the coloured bars representing the 5 largest WSA regions: green; light blue; yellow; grey & orange. The continuous black horizontal line represents the 5-year average from 2018/19 to 2022/23 for the other WSAs with the dashed black line the five-year average for the state. Data is in greasy tonnes.
In Victoria, the greatest volumes of wool tested originated from WSA regions V21 (14.6%), V18 (10.7%), V25 (9.8%), V07 (9.4%) and V22 (9.1%) (Figure 5a). Collectively, these five WSAs represented 53.6% of the total weight of wool tested in Victoria during 2023/24.
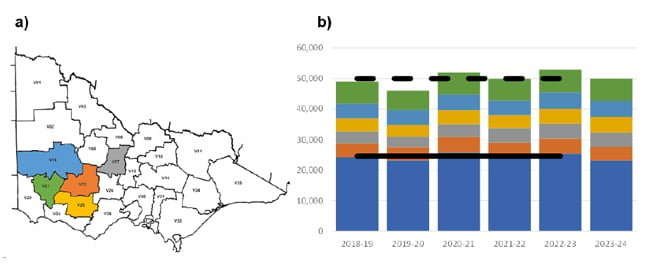
Figure 5: a) The five Victorian regions from which the greatest volumes of wool tested originated and b) The total wool test volumes for the 2023/24 season compared with previous seasons (2018/19 to 2022/23). The larger blue portion of each column represents the other WSA regions with the coloured bars representing the 5 largest WSA regions: green; light blue; yellow; grey & orange. The continuous black horizontal line represents the 5-year average from 2018/19 to 2022/23 for the other WSAs with the dashed black line the five-year average for the state. Data is in greasy tonnes.
In Western Australia, the greatest volumes of wool tested originated from WSA regions W12 (19.4%), W09 (18.2%), W10 (13.0%), W07 (8.9%) and W11 (7.9%) (Figure 6a). Collectively, these five WSAs represented 67.4% of the total weight of wool tested in Western Australia during 2023/24 July to March (Figure 6b).
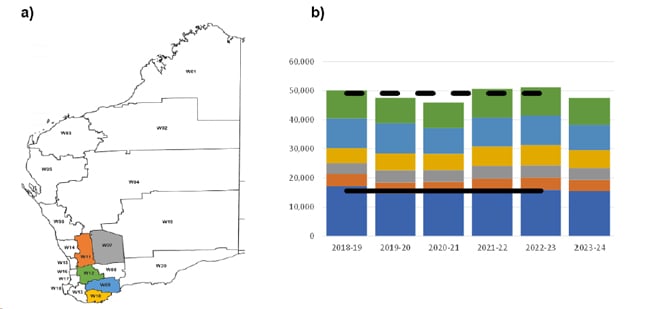
Figure 6: a) The five Western Australian regions from which the greatest volumes of wool tested originated and b) The total wool test volumes for the 2023/24 season compared with previous seasons (2018/19 to 2022/23). The larger blue portion of each column represents the other WSA regions with the coloured bars representing the 5 largest WSA regions: green; light blue; yellow; grey & orange. The continuous black horizontal line represents the 5-year average from 2018/19 to 2022/23 for the other WSAs with the dashed black line the five-year average for the state. Data is in greasy tonnes.
In South Australia, the greatest volumes of wool tested originated from WSA regions S29 (18.9%), S15 (9.4%), S06 (8.3%), S13 (8.1%) and S30 (7.8%) (Figure 7a). Collectively, these five WSAs represented 52.2% of the total weight of wool tested in South Australia during 2023/24 July to March (Figure 7b).
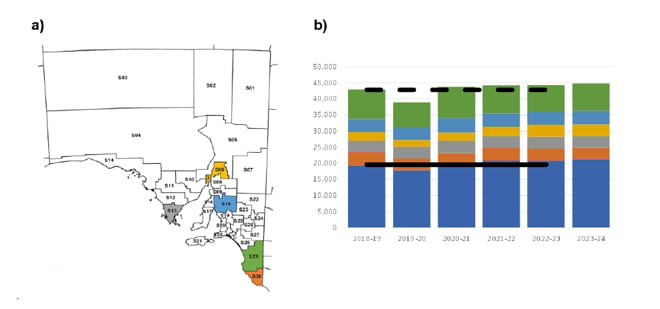
Figure 7: a) The five South Australian regions from which the greatest volumes of wool tested originated and b) The total wool test volumes for the 2023/24 season compared with previous seasons (2018/19 to 2022/23). The larger blue portion of each column represents the other WSA regions with the coloured bars representing the 5 largest WSA regions: green; light blue; yellow; grey & orange. The continuous black horizontal line represents the 5-year average from 2018/19 to 2022/23 for the other WSAs with the dashed black line the five-year average for the state. Data is in greasy tonnes.
In Tasmania, the greatest volumes of wool tested originated from WSA regions T05 (32.1%), T04 (30.0%), T03 (23.4%), T06 (8.9%) and T01 (3.6%) (Figure 8a). Collectively, these five WSAs represented 98.0% of the total weight of wool tested in Tasmania during 2023/24 (Figure 8b).
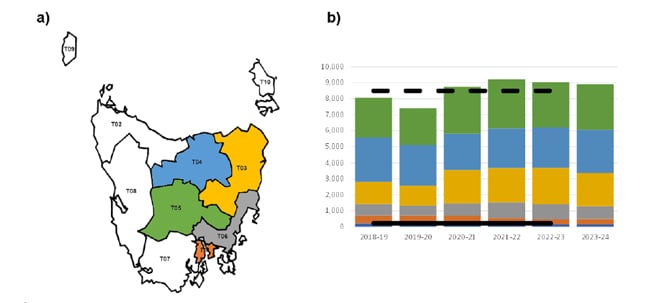
Figure 8: a) The five Tasmanian regions from which the greatest volumes of wool tested originated and b) The total wool test volumes for the 2023/24 season compared with previous seasons (2018/19 to 2022/23). The larger blue portion of each column represents the other WSA regions with the coloured bars representing the 5 largest WSA regions: green; light blue; yellow; grey & orange. The continuous black horizontal line represents the 5-year average from 2018/19 to 2022/23 for the other WSAs with the dashed black line the five-year average for the state. Data is in greasy tonnes.
In Queensland, the greatest volumes of wool tested originated from WSA regions Q12 (25.1%), Q23 (11.6%), Q15 (9.5%), Q21 (8.3%) and Q22 (6.7%) (Figure 9a). Collectively, these five WSAs represented 61.2% of the total weight of wool tested in Queensland during 2023/24 (Figure 9b).
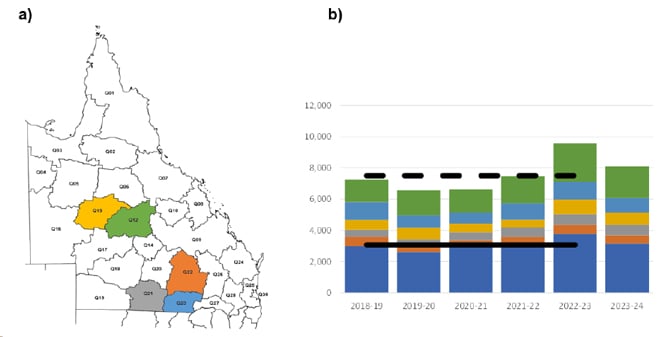
Figure 9: a) The five Queensland regions from which the greatest volumes of wool tested originated and b) The total wool test volumes for the 2023/24 season compared with previous seasons (2018/19 to 2022/23). The larger blue portion of each column represents the other WSA regions with the coloured bars representing the 5 largest WSA regions: green; light blue; yellow; grey & orange. The continuous black horizontal line represents the 5-year average from 2018/19 to 2022/23 for the other WSAs with the dashed black line the five-year average for the state. Data is in greasy tonnes.
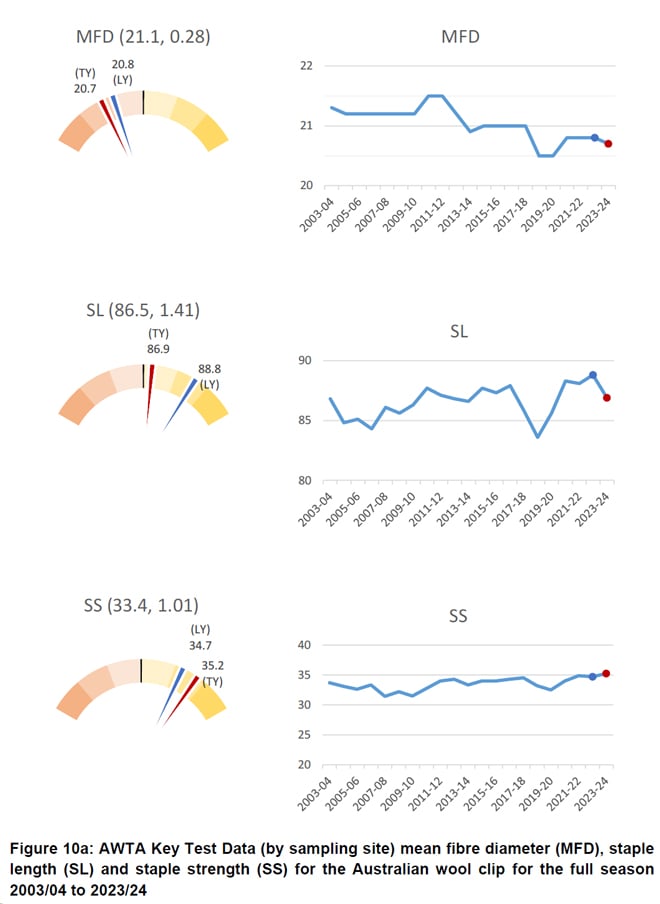
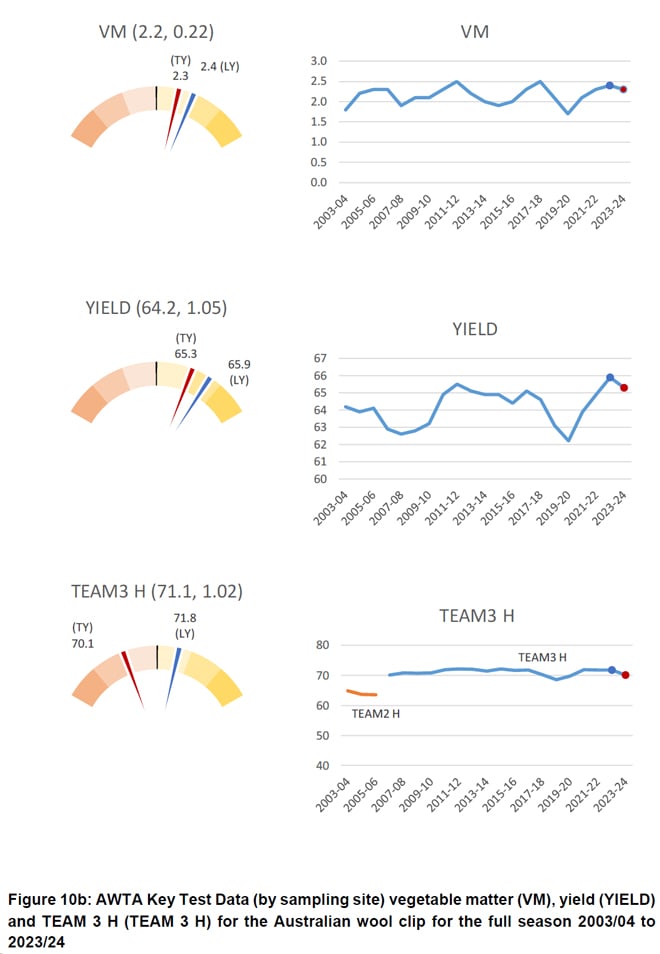
A graphical representation of the AWTA Key Test Data changes in mean fibre diameter (MFD), vegetable matter (VM), staple length (SL), yield (YIELD), staple strength (SS) and hauteur (TEAM 3 H) from the 2003/04 to the 2023/24 season is shown in Figure 10. On each graph the red dot represents the mean value of each characteristic for the 2023/24 season while the blue dot represents the mean for the 2022/23 season. The values above the gauge on the left-hand side of each graph show the mean and standard deviation respectively for that characteristic from 2003/04 to 2023/24. Each coloured segment on the gauges represents one standard deviation with the mean at 12 o-clock (centre). For MFD, VM, SL, YIELD and SS, the mean and standard deviation are based on data from the 2003/04 season onwards. For TEAM 3 the mean and standard deviation are based on data from the 2006/07 season onwards. The red line on each gauge is the mean for the 2023/24 season (TY), while the blue line is the mean for the 2022/23 season (LY).
- On a national basis, compared with the 2022/23 season, mean fibre diameter was 20.7 microns down 0.1 micron, staple length was down 1.9 mm to 86.9 mm and staple strength was up 0.5 N/ktex to 35.2 N/ktex (Figure 10a).
- Vegetable matter down 0.1% to 2.3%, yield was down 0.6% to 65.3% and predicted hauteur (TEAM 3) was down 1.7 mm to 70.1 mm (Figure 10b).
AWEX auction statistics
The AWEX first-hand auction statistics for the 2023/24 season (297.9 Mkg greasy) show no change compared with the 2022/23 season (298 Mkg greasy, Table 5).
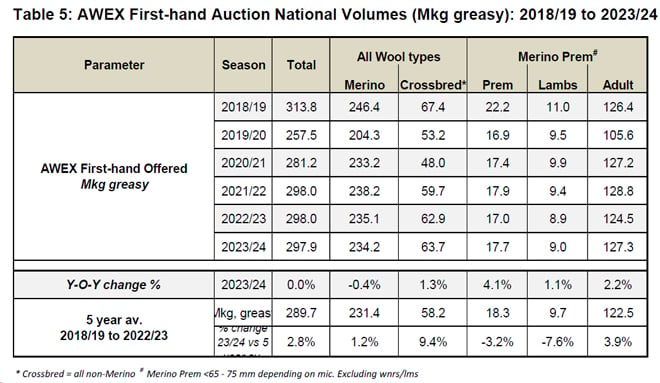
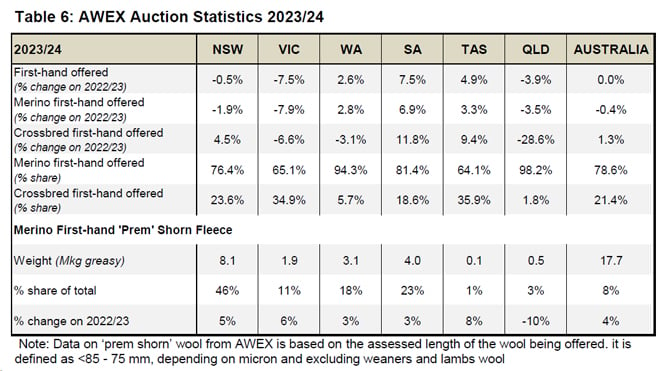
- First-hand bales offered increased in South Australia (up 7.5%), Tasmania (up 4.9%) and Western Australia (up 2.6%). Decreases occurred in Victoria (down 7.5%), Queensland (down 3.9%) and New South Wales (down 0.5%) (Table 6).
- The volume of first-hand Merino wool offered across Australia decreased by 0.4% with a 1.3% increase in first-hand Crossbred wool offered. The share of Merino wool of all first-hand offered wool was 78.6% in 2023/24, compared with 78.9% in 2022/23 and 80.0% in 2021/22.
- There was a 4.0% increase in the volume of ‘Prem-shorn’ Merino fleece wool in 2023/24 (17.7 Mkg) compared with 2022/23 (17.0 Mkg).
- As a percentage share of the total first-hand wool offered, 8% of Australian first-hand bales offered were prem shorn in 2023/24. On a state-by-state basis this ranged from 1% in Queensland to 46% in New South Wales.
Australian Bureau of Statistics (ABS) data
Sheep turn-off
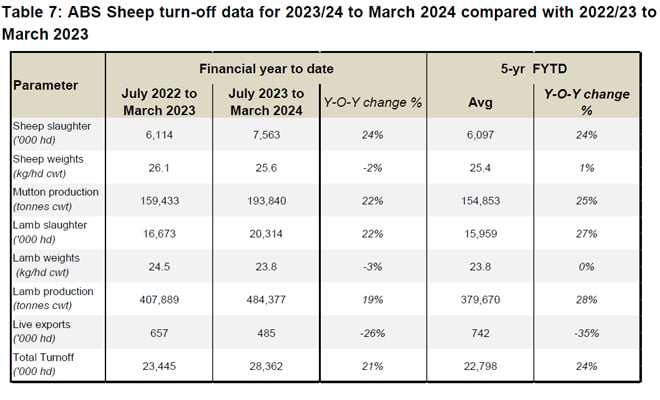
Australian sheep and lamb turn-off statistics during July 2023 to March 2024 season are shown in Table 7:
- There was a 24% increase in sheep slaughter, and an 22% increase in lamb slaughter compared with the same nine months during 2022/23.
- Sheep slaughter was 24% above the five-year average with lamb slaughter 27% higher than the five-year average.
- The number of live sheep exported from Australia decreased by 26% between July 2023 to March 2024 and were 35% below the five-year average.
- Total turnoff of sheep and lambs between July 2023 to March 2024 was 21% higher than the same nine months in 2022/23 and 24% above the five-year average.
Bureau of Meteorology (BoM) seasonal rainfall seasonal outlook
Seasonal conditions during the 2023/24 were average to below average in Western Australia, South Australia, Victoria and Tasmania (Figure 11). The major wool producing regions in these states had very much below average to lowest on record rainfall deciles. The main wool producing regions in New South Wales and Queensland received average to above rainfall.
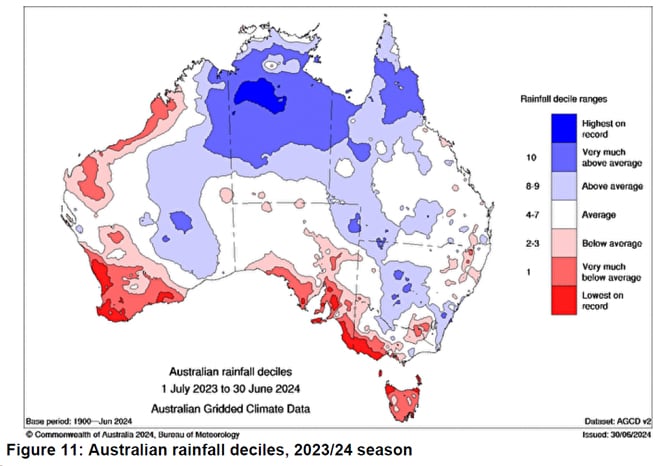
The landscape water balance in the major wool producing regions reflects seasonal conditions and rainfall (Figure 12).
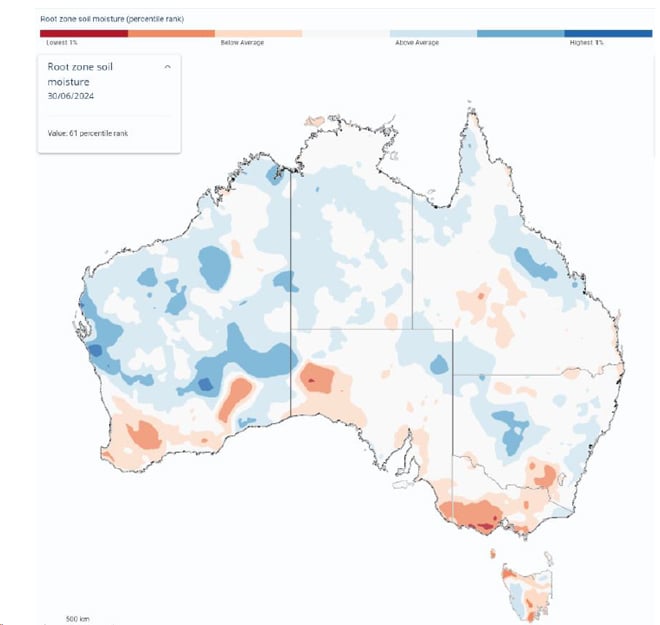
Figure 12: Australian landscape water balance, at 30 June 2024 (Source: Bureau of Meterology)
The Bureau of Meteorology’s outlook for September to November 2024 is for rainfall to be within the typical range for most of the country. Above average rainfall is likely in the major wool producing regions of Queensland, New South Wales, Victoria and Tasmania (Figure 13). Average to below average rainfall is expected in South Australia and Western Australia. Above average median maximum temperatures are likely to very likely (60 to greater than 80% chance) for most of Australia (Figure 14).
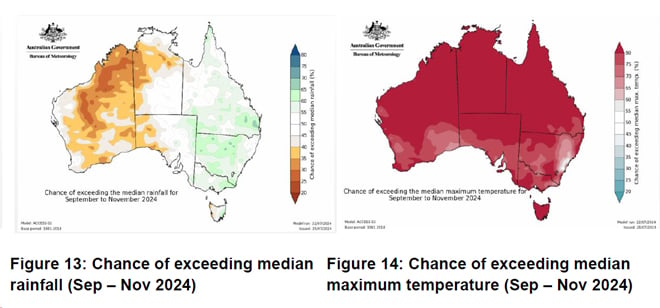
In its update on 25 July 2024, the Bureau noted that the El Niño – Southern Oscillation (ENSO) was currently neutral and likely to remain so until at least early spring. The ENSO Outlook remains at La Niña watch.
Results from the MLA and AWI Sheep Producers Intentions Survey
The MLA and AWI Sheep Producers Intentions Survey – May 2024 indicated a reduction in producer sentiment regarding both the wool (-24 points) and sheepmeat (+4 points) sectors compared to sentiment in May 2023 (+13 and +27 points respectively).
Seasonal conditions, feed availability, input costs, availability of labour as well as sheep and wool prices are the key factors impacting on on-farm decision making.
Nationally, 36% of sheep producers intend to maintain their flock size from 2024 to 2025, with 42% intending to decrease.
State Committee input
The following provides a summary of seasonal conditions and the wool production estimate for 2023/24 and forecast for 2024/25 as reported by the AWPFC state committees in August 2024.
New South Wales
Varied production conditions across New South Wales since April 2024 with sheep numbers stable on a whole state basis. Low mutton prices earlier in 2023/24 prompted producers to retain excess sheep, but subsequent peaks in mutton prices coupled with the tough season prompted producers to reduce numbers of retained sheep and young wethers. Reductions in on-farm and wool broker stocks of wool during 2023/24 correspond with the AWEX first-hand auction data (-0.5%). The New South Wales Committee’s estimate of shorn wool production for 2023/24 is 119.5 Mkg greasy, up 0.4% on 2022/23.
Generally, there has been a late start to the 2024/25 season across most of the NSW with many producers hand feeding their flocks, late crop establishment and very cold weather conditions. Northern regions have been reasonably good, the Southern slopes region fared better with grazing crops able to fill the mid-winter feed gap. The Central and Southern Tablelands are in a green drought, with the available green pick not sufficient to sustain breeding ewes and their lambs. The Riverina, areas south of Wagga and around Griffith, have been drought declared by the NSW Department of Primary Industries and Regional Development.
Scanning percentages were high, but low lambing percentages reported, especially among spring lambing flocks. Per head production has been variable, reports of increased wool cuts in some regions were counterbalanced by tough seasonal conditions in others. Overall, per head production is expected to be 2.2% lower than 2022/23 due to the tough end to the season and below the long-term NSW average of 4.55 kg greasy.
Grower sentiment is highly negative in many regions with reports of Merino and crossbred flocks moving towards shedding breeds as producers react to low wool prices and relatively high shearing costs (approximately 30% of wool returns). The cost of shearing has decreased the number of producers shearing at six-monthly intervals. Reports of sheep being sold unshorn, large sheep properties sold in the New England region that will no longer be used sheep production and increased cattle agistment on sheep properties.
The Bureau of Meteorology’s seasonal outlook for New South Wales is reasonably favourable. Soil moisture in the Southern Slopes and Monaro regions is good with strong pasture growth expected when temperatures rise. The New South Wales Committee’s second forecast of shorn wool production for 2024/25 is 111.4 Mkg greasy, down 6.8% on 2023/24.
Victoria
Average rainfall deciles in the eastern regions of Victoria were offset by very much below average to lowest on record deciles in the southern west of Victoria where most of the state’s wool is grown. Poor rainfall and low feed availability after a run of good seasons has negatively impacted sheep numbers with producers actively reducing their flock size. Sheep and lamb slaughter (to March 2024) were up by 10% and 33% respectively compared with the 2022/23 season to March 2023. Producers were carrying higher sheep numbers at the beginning of 2023/24 due to a run of good seasons and low sheepmeat prices. The number of hectares under crop continued to increase.
High scanning percentages were achieved early in the season as breeding ewes were in good condition. Some sell off of ewes carrying twins and triplets occurred following scanning to reduce flock feed demand. Remaining breeding ewes generally started lambing in good condition, however the season deteriorated significantly. Producers were managing ewes with high nutritional demands with full hand feeding in many regions with containment continuing through lambing. On-farm and industry stocks of hay and grain have diminished, particularly in the southwest where little pasture feed is available due to on-going frosts leeching soil moisture and halting pasture growth. Wether numbers have decreased. Marking rates were reasonable, but lambs are in low condition with lower weaning percentages expected.
Average cut per head is expected to reduce due to the tough seasonal conditions. Sheep shorn early prior to sale, on-time shearing compared to June and July 2023 (which was delayed due to wet weather a shearer availability) and a shift away from Merino production to composite breeds are the key impacting factors. The Victorian Committee’s estimate of shorn wool production for 2023/24 is 65.6 Mkg greasy, down 6.3% on 2022/23.
The Bureau of Meteorology’s outlook is for above average median rainfall for much of Victoria with above average median maximum temperatures. Sheep flocks are being reduced back to core breeding stock. Difficult lambing conditions for many flocks is expected to reduce joining percentages in 2024/25 with producers currently making decisions regarding how many ewes to join and which ram breeds to use. Current sentiment indicates reduced Merino joinings. Widespread sheep feeding continued into August with sheep producer’s cash flow negatively impacted by large feed bills. High shearing costs coupled with increased skin value are prompting producers to sell lambs unshorn.
Crop production is expected to continue to increase on available arable land at the expense of sheep production, ranges country is expected to remain Merino focussed due to limited alternative options. Shearing and lambing marking are underway, wool cuts and making percentages are both expected to decline compared with 2023/24. The Victorian Committee’s second forecast of shorn wool production for 2024/25 is 55.9 Mkg greasy, down 14.8% on 2023/24.
Western Australia
Northern and eastern sheep production regions have had a generally better season than southern regions. Southern regions, where most of the state’s wool clip is grown, received very much below average to lowest on record rainfall deciles for the season. Producers in southern regions have been feeding sheep through winter with feed and shearing costs front of mind. The poor season coupled with low sheepmeat and wool prices, processing capacity and the phase out of live exports have decreased sheep producer sentiment.
Merino sheep numbers have been reduced, with interstate transfer of approximately 830,000 head of mainly breeding ewes many carrying six or more months of fleece. Reduced numbers of ewes were joined, with an increased proportion of Merino ewes mated to crossbred rams and large numbers of crossbred lambs on the ground in north and eastern regions. The number of ewes scanned was significantly lower than 2022/23 with lower lambing percentages reported and fewer lambs marked. Increased use of shedding breeds in some regions with investment in feedlot infrastructure at the expense of wool handling facilities making a return to Merino production difficult.
Average cuts per head are expected to be lower. While the first quarter of the season was reasonable, conditions in key wool producing regions (WSAs W07, W09. W10, W11 & W12) began to deteriorate from October and continued through to the end of the season. Average fibre diameter, staple length and staple strength are all expected to decrease. AWTA wool test data and AWEX auction data were inflated by producers opting to sell stored wool to generate cash flow to offset sheep feeding costs. Little stored wool remains on-farm or in brokers stores. The Western Australian Committee’s estimate of shorn wool production for 2023/24 is 55.0 Mkg greasy, down 9.3% on 2022/23.
Northern and eastern sheep production regions have recovered somewhat with good rains in June and July. However, the lack of rainfall and run-off into dams means stock water going into summer remains a keen concern and will restrict stock numbers in southern regions. A couple of good months of rain is required to top up on-farm stock water supplies, however the Bureau of Meteorology’s seasonal outlook remains poor for the major wool producing regions.
The recent improvement in sheep meat prices has seen producer sentiment rebound. Some reports of producers increasing stock numbers to take advantage of improved sheepmeat prices. Interstate transfer of sheep reduced during June and July but is expected to lift in spring.
Northern and eastern regions have had some pasture feed coming through in the past 4 to 6 weeks. Producers have stopped feeding, but pasture is not yet sufficient to maintain sheep condition. This may reduce joining and scanning percentages. New season lambs are about a month behind, first drafts for sale are expected in September rather than August. Pasture remains a limiting factor in major wool producing regions.
Ewes remaining on-farm will be shorn during 2024/25, with producers yet to make decisions regarding the number to be joined and the ram breed used. Abattoir capacity may see a reduction in crossbred rams mated to Merino ewes and an increase in Merino ram usage, but wool prices will be a deciding factor. The Western Australian Committee’s second forecast of shorn wool production for 2024/25 is 44.7 Mkg greasy, down 18.8% on 2023/24.
South Australia
Dry conditions across most of South Australia, except the northeast region. The southeast corner received very much below average or lowest rainfall deciles on record. The pastoral region is dry with the mid north holding but beginning to dry out, despite some late rain (conditions were too cold for pasture growth). The inside country is experiencing a green drought, with a green pick of poor nutritive value. Ewe with lambs on foot are chasing the green pick and losing condition. All regions need follow up rain.
Sheep producers have continued to reduce numbers, this includes retained sheep held over from 2022/23 due to low sheepmeat prices. Where possible producers have extended cropping programs and reduced livestock (cattle and sheep), fewer producers in mixed farming regions are running sheep. Producers with sufficient on-farm feed stocks or who managed to buy sufficient feed are maintaining numbers.
Reports of poor lambing, marking and weaning percentages across the state due to the tough season. Producers in the southeast have been containment feeding their flocks. Fibre diameter and yield are expected to decrease as the dry conditions and very cold winter take their toll on sheep condition and production. Some lambing is on par due to tailored feeding regimes.
Producer negativity is widespread due to the increased costs of production and low wool prices. High shearing costs have seen a reduction in six-monthly shearing with producers moving back to annual shearing. Average per head production is expected to reduce due to the gradual and long decline in feed. The expected decline in wool quality is apparent in the AWTA key test data which showed reductions in fibre diameter, staple length and yield with an increase in vegetable matter. Very low wool stocks are held on-farm or in brokers stores. The South Australia Committee’s estimate of shorn wool production for 2023/24 is 58.0 Mkg greasy, up 2.3% on 2022/23.
The seasonal outlook shows average to above average median rainfall for the eastern regions of the state, but below average for western regions with above average maximum temperatures. Continuing frosts are hampering pasture growth.
Some Merino studs are positive for the upcoming ram sale season, hoping for increased clearance rates albeit at lower prices. Low volumes of ram purchases were widespread during in 2023/24 and may continue into 2024/25. Producers who have stayed with Merino production are hanging on for better times, expecting to reap the benefits when wool prices recover. The cost of production is reducing the incidence of pre-shearing crutching due to the dry season. Cast-for-age sheep are expected to be sold in the wool, especially crossbreds, with the pelt disposal fee being lower than the shearing cost. Store lambs will be in high supply which may decrease their value. The South Australian Committee’s second forecast of shorn wool production for 2024/25 is 55.1 Mkg greasy, down 5.0% on 2023/24.
Tasmania
Very much below average rainfall deciles across Tasmania, particularly in the key wool producing regions (T01 and T03 to T06). This significantly reduced soil moisture and pasture production during 2023/24. Producers reduced sheep numbers in November and December 2023 following the dry spring. Sheep slaughter to the end of the March quarter was up 98% on the same time in 2022/23 with lamb slaughter up 25%. While smaller flock disposals are increasing (i.e. flocks with fewer than 500 ewes), larger producers are tending to maintain their numbers.
Many producers have been hand feeding their stock since October and were reluctant to sell sheep before the rise in sheepmeat prices. Average cuts per head are expected to remain at historically low levels, due to the poor season limiting production and crossbred wool comprising 36% of the state’s auction offering. AWTA key test data show the average fibre diameter continuing to increase over time, but a small year-on-year reduction of 0.1 µm to 21.9 µm. Staple length was 86.3 mm (down 3.9 mm) with small reductions in VM (0.1%) and yield (-0.4%) for the 2024/23 season reflecting the tough sheep production conditions. AWEX auction offerings for the season were inflated by held-over crossbred clips from 2022/23 sold to generate cash flow. The Tasmanian Committee’s estimate of shorn wool production for 2023/24 is 9.3 Mkg greasy, down 8.8% on 2022/23.
The seasonal outlook for the key wool producing regions is favourable with above average median rainfall forecast between September to November. August rainfall deciles were average to above average with early indications of the north westerly weather pattern returning, albeit late. Rainfall and runoff to replenish on-farm dam water supplies for stock is a key concern going forward. Another failed spring is expected to generate a further sell-off of sheep.
Producers remain despondent regarding wool prices. While sheepmeat prices have improved, the cost of freight across the Bass Straight is effectively reducing the on-farm sale value by up to 20% compared with mainland prices. Shearing is in full swing at present. With early spring lambing underway in some regions. A decent spring is expected to see some rebuilding of sheep flocks. Producers will make decisions on the number of ewes to retain and join following spring when the likely pasture feed availability for summer is more apparent.
Seasonal conditions and shearing results over the next three months will provide a clearer picture of producer intentions, sheep numbers and per head production for the coming season. At this early stage, the favourable seasonal outlook is likely to generate a small improvement in average wool cut per head. The Tasmanian Committee’s second forecast of shorn wool production for 2024/25 is 8.3 Mkg greasy, down 10.8% on 2023/24.
Queensland
Average to above average rainfall deciles in the key Queensland wool producing regions (Q12, Q23, Q15, Q21 & Q22) has produced a good season throughout much of the state. While there is a good body of dry feed with green pick in these regions, sheep are not doing as well as expected due to a lack of available protein. In some regions a run of frosts has reduced feed quality with producers full hand feeding to keep young sheep growing. While this will reduce parasite (worm) and locust activity in spring and summer, current sheep production has been negatively impacted. Marking rates are expected to be lower, with fewer lambs on farm.
Sheep numbers are expected to remain relatively stable, despite producer negativity regarding the cost of shearing and freight costs to send sheep to slaughter. Reports of flock disposals continue.
Shearing during 2023/24 has returned to the normal 12-month pattern, following widespread rain delays during 2022/23 of between 6 to 10 weeks. Reports of more shearing contractors working in the state running more shearing teams than usual has meant clips are being shorn
on time. This accounts for some of the 3.5mm year-on-year reduction in staple length (from 90.7 to 87.2 mm). Per head production is likely to remain at lower-than-average levels and similar to the 2022/23 season. The reduction in feed quality has contributed to the 0.7 µm year-on-year reduction in fibre diameter to 19.4 µm which is significantly lower that the 20- year average for Queensland (20.1 µm).
The 16% reduction in AWTA weight of wool tested during 2023/24 was due to a five-year high in test volumes during 2022/23 (10.71 greasy tonnes) and wool normally tested in June being rolled into July (July 2024 test volumes were up 15.3%). The Queensland Committee’s estimate of shorn wool production for 2023/24 is 10.1 Mkg greasy, down 10.6% on 2022/23.
The seasonal outlook for wool producing regions in Queensland is favourable with average to above median rainfall for September through to November. Significant numbers of sheep were sent to slaughter in New South Wales during June and July that were held onto in 2023/24
due to low sheepmeat prices.
Labour availability and input costs remain front of producers’ minds, with stock numbers being reduced to levels that can be managed without external labour. The positive impact of sheep on pasture management relative to cattle is keeping some producers running sheep rather than transitioning to cattle. Larger producers are concerned with the flat to cheaper wool market in the medium to long term, current prices are not sustainable against the rising cost base and capital tied up against low returns.
July through to September are a key time for shearing in Queensland and will provide the Committee will a clearer picture of sheep numbers and per head production. This together with the seasonal conditions in coming months will provide a stronger basis to revise their 2024/25 forecast in December. The increase in sheepmeat prices 12 months ago has prompted dual purpose Merino producers to continue their emphasis on balanced Merino pursuing increased wool cut and meat production. The Queensland Committee’s second forecast of shorn wool production for 2024/25 is 10.1 Mkg greasy, no change on 2023/24.
Appendix
Table A1: Comparison of shorn wool production in 2023/24 against the 2022/23 season and the second forecast for 2024/25 against the 2023/24 season
At their September 2022 meeting, the AWPFC National Committee resolved to include a clean estimate of shorn wool production based on the yield (%, Schlumberger dry top and noil yield) from the AWTA key test data for each complete season.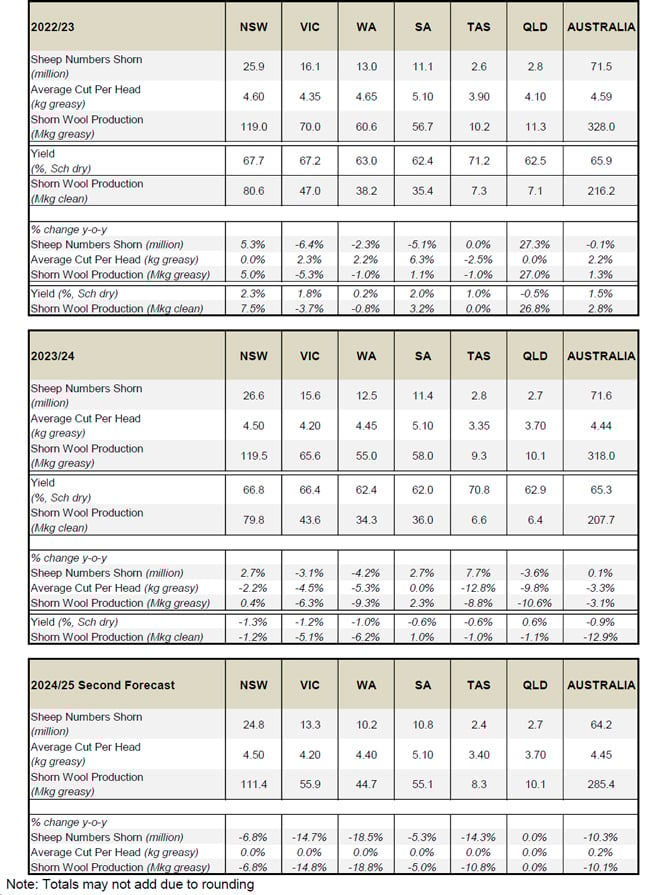
Historical Australian Production Figures
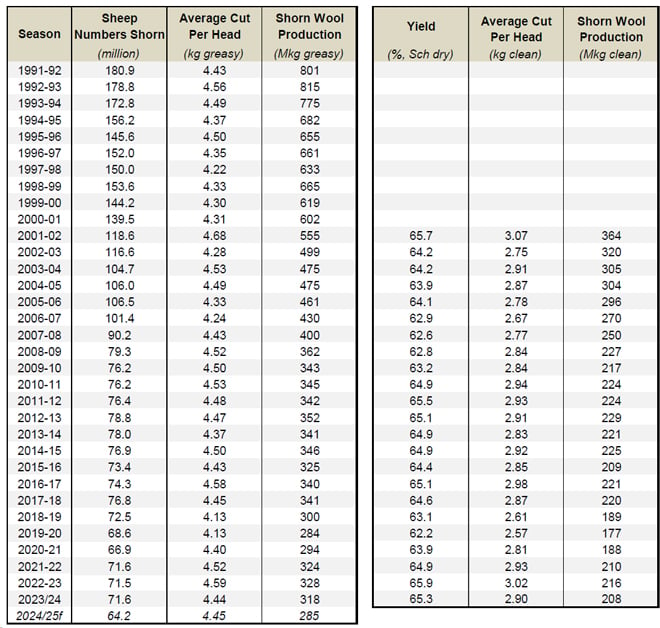
The tables below provide historical sheep shorn numbers, wool production, fleece weight and micron share statistics since 1991/92 for background information.
Table A2: Australian wool production statistics since 1991/92
At their September 2022 meeting, the AWPFC National Committee resolved to include a clean estimate of shorn wool production for each full season based on the yield (%, Schlumberger dry top and noil yield) from the AWTA key test data for that season.
Explanation of revised AWPFC data series
At the December 2005 meeting, the National Committee made the decision to collate and review the key variables (shorn wool production, cut per head, number of sheep shorn) used in the committee from the available industry sources and to create a consistent historical data series at both a state and national level. This was required as some differences existed between industry accepted figures and the AWPFC data series and to ensure a consistent methodology over time. This process resulted in changes to the parameters ‘average cut per head’ and the ‘number of sheep shorn’ for some seasons at both a state and national level.
Modus operandi for the Australian Wool Production Forecasting Committee
The Australian Wool Production Forecasting Committee draws together a range of objective data and qualitative information to produce consensus-based, authoritative forecasts four times a year for Australian wool production. The Committee has a two-level structure, with a National Committee considering information and advice from state committees. It is funded by Australian Wool Innovation Limited, which also provides a representative in the role of the Chairman of the National Committee. The National and state committees comprise wool producers, wool brokers, exporters, processors, private treaty merchants, AWEX, AWTA, ABARES, ABS, MLA, state departments of Agriculture, sheep pregnancy scanners and AWI. The Committee releases its forecasts in the forms of a press release and a report providing the detailed forecasts, historical data and commentary on the key drivers of the forecasts.