Australian Wool Production Forecast Report December 2024

The Australian Wool Production Forecasting Committee’s (AWPFC) estimate of shorn wool production for 2024/25 is 279.4 million kilograms (Mkg) greasy, 12.0% lower than the 2023/24 season estimate, and a 6 Mkg greasy downward revision of the August 2024 forecast.
-
Australian shorn wool production for 2024/25 is 279.4 million kilograms (Mkg) greasy, 12.0% lower than the 2023/24 season estimate, and a 6 Mkg greasy downward revision of the August 2024 forecast.
-
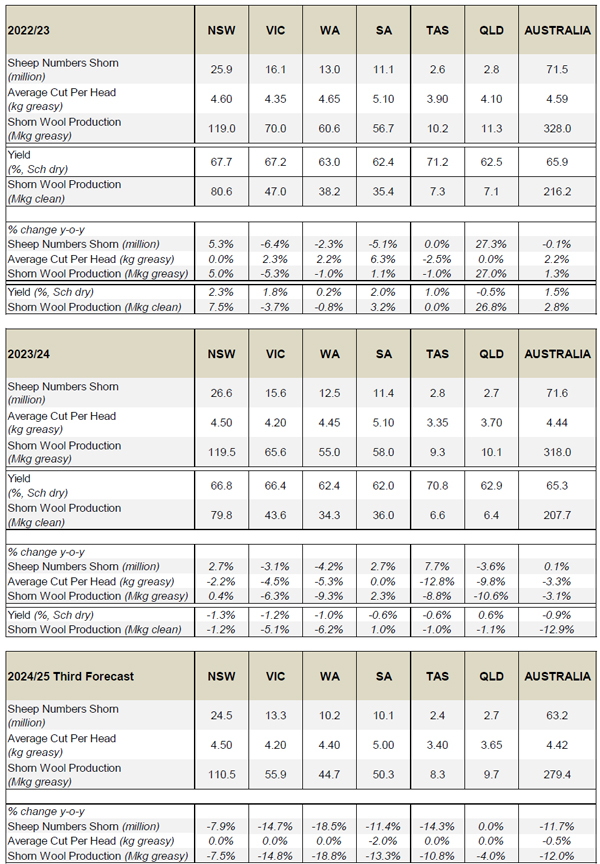
New South Wales is forecast to have the largest sheep flock, shearing 24.5 million head (down 7.9% compared with 2023/24) and produce 110.5 Mkg greasy wool (down 7.5% compared with 2023/24). Victoria is expected to shear 13.3 million sheep (down 14.7%) and produce 55.9 Mkg greasy (down 14.8%) with Western Australia forecast to produce 44.7 Mkg greasy (down 18.8%) from 10.2 million sheep shorn (down 18.5%). South Australia is forecast to shear 10.1 million head (down 11.4%) and produce 50.3 Mkg greasy (down 13.3%). The number of sheep shorn in Queensland (2.7 million head, unchanged) and Tasmania (2.4 million head, down 14.3%) are expected to produce 9.7 Mkg greasy (down 4.0%) and 8.3 Mkg greasy (down 10.8%) respectively.
-
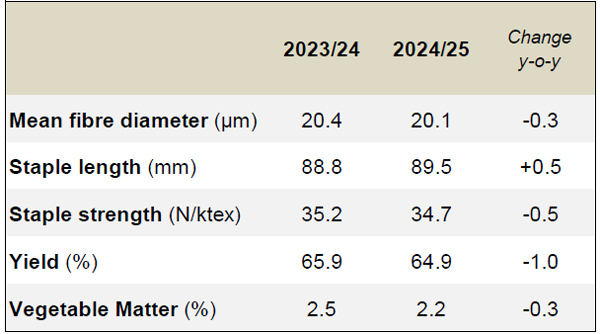
Average cut per head is forecast to be comparable with 2023/24, at 4.42 kg greasy (down 0.5%). AWTA key test data for the 2024/25 season to the end of November show small year-on-year changes in mean fibre diameter (down 0.3 microns), staple length (up 0.5mm), staple strength (down 0.5 N/ktex), yield (down 1%) and vegetable matter (down 0.3%).
-
Sheep slaughter from July to September 2024 is up 28% compared with the same time in 2023 and is 63% above the five-year July to September average. Lamb slaughter is down 4% compared with July to September 2023 but remains 17% above the five-year average.
-
AWTA wool test volumes for the 2024/25 season July to November were down by 9.9% on a year-on-year basis. The volume of wool tested decreased in all states.
-
First-hand offered wool at auction during 2024/25 to week 22 were down by 17.0% with decreases in all states.
-
The October 2024 Sheep Producer Intentions Survey (SPIS) indicated producer outlook for wool remains low with a net sentiment of -19. Almost twice as many producers now have a negative outlook (36%) than a positive outlook (17%) regarding the wool industry. The outlook for the sheepmeat sector was more positive at +42 points. Producer sentiment in Western Australia remains significantly lower for both the wool and sheepmeat industries than other states.
-
The Bureau of Meteorology is forecasting rainfall to be within the median to above the median range for most of the country with above average median maximum temperatures likely to very likely for most of Australia.
-
Wool producers are making decisions regarding their enterprise mix due to commodity prices, input costs and other external factors. Together with variable seasonal conditions, these decisions are pointing towards structural change in the wool industry evident in declining numbers of sheep shorn and consequently shorn wool production.
-
Table 1 summarises Australian wool production and Table 2 shows the total shorn wool production by state. Table 3 provides a comparison of AWTA key test data for the 2024/25 and 2023/24 seasons from July to November.
Table 1: Summary of Australian wool production
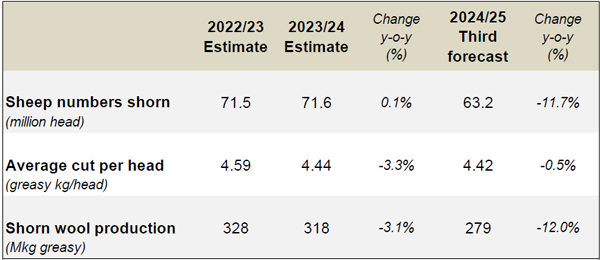
Table 2: Total shorn wool production by state
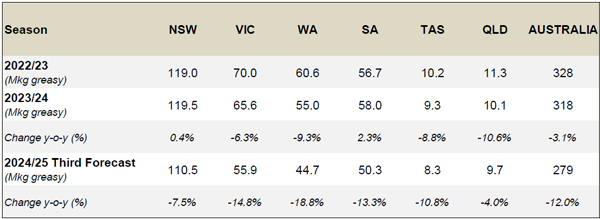
Table 3: AWTA key test data for 2022/23 and 2023/24 (July to March)
- More detailed information on the shorn wool production by state in 2024/25 can be found in Table A1 in the Appendix to this report.
- The Appendix also provides historical data for Australia, including sheep shorn numbers, average cut per head and shorn wool production (Table A2) as well as the micron profile (Table A3) since 1991/92.
Detail on shorn wool production for the 2024/25 forecast
Major data inputs
The AWPFC forecasts are based on detailed consideration by the state and national committees of data from various sources including:
- AWTA wool test data for the 2024/25 season from July to November 2024;
- AWEX first-hand auction statistics for the 2024/25 season from July to November 2024 (Week 22);
- ABS sheep and lamb turn-off for the 2024/25 season to September 2024;
- Information on current and expected seasonal conditions from the Bureau of Meteorology; and
- Survey information from the MLA/AWI Sheep Producer Intentions Survey conducted in October 2024.
AWTA wool test data
Every month AWTA releases data on the volumes of greasy wool tested within the various diameter categories for the month and the season to date. Data for the 2024/25 season from July to November are compared with the corresponding five months in previous seasons (2019/20 to 2022/23).
The month-by-month comparison of wool tested during the 2024/25 season showed test volumes below the five-year average in July, August, September and November. Test volumes for October 2024 were second only to those in October 2023. (Figure 1).
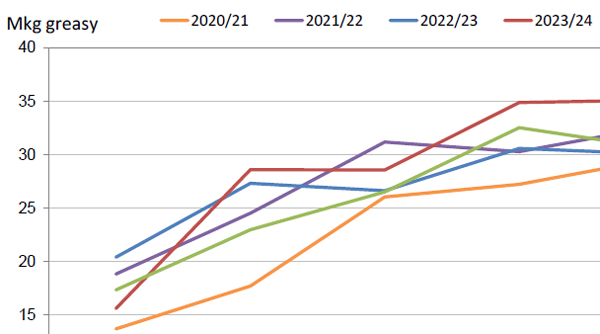
Figure 1: Comparison of monthly AWTA key test data volumes for the 2024/25 season with previous seasons (2020/21 to 2023/24)
AWTA national wool test volumes data for the 2024/25 July to November (Table 4) shows:
- Volumes of wool tested were 9.9% lower than July to November during 2023/24 at 128.7 Mkg greasy. This was 2.1% lower than the July to November five-year average from 2019/20 to 2023/24.
- There were increases in the weight of wool tested in less than 16.6 microns (up 21.9%) and 17 microns (up 1.9%) categories. The weight of wool tested in all other micron categories decreased by between 2.7% (25 – 26 microns) and 25.8% (29 – 30 microns microns).
- The largest micron categories by volume were the 19-micron (26.0 Mkg greasy), 18-micron (24.9 Mkg greasy) and 20-micron (17.6 Mkg greasy) categories.
- The micron split (% of total weight of wool tested) during July to November in 2024/25 was similar to that tested during the same five months of 2023/24. The difference across the micron categories ranged from -1.9% (20-micron) to +2.0% (less than 16.6 microns).
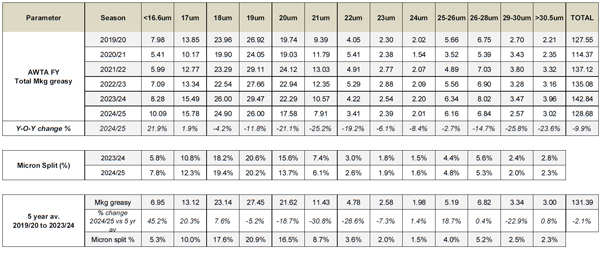
Note: The micron categories refer to a range of -0.4 and +0.5um around each number. For example, 18um is between 17.6 and 18.5 microns
The micron profile of the Australian wool clip continues to have two distinct peaks; one centred around 19-micron wool (finer than 16.6 microns up to 23 microns) and a second centred around 26 - 28 microns (from 24 microns to 30.5 microns and broader) (Figure 2).
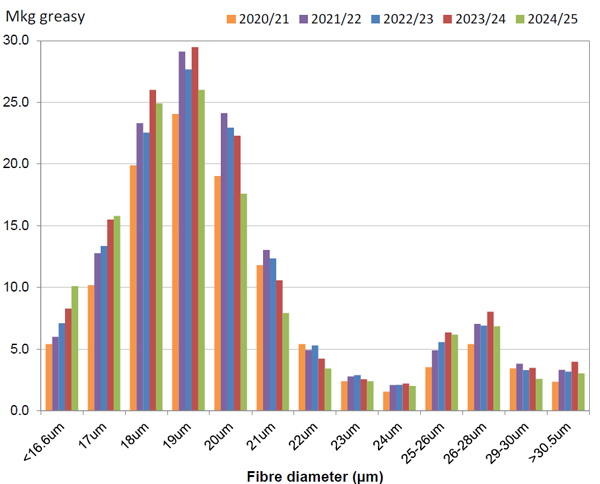
Figure 2: Australian fibre diameter profile – 2024/25 season July to November compared with the 2020/21 to 2023/24 seasons
A historical comparison of the Australian wool clip’s micron profile percentage share and average micron can be found in Appendix Table A3 (at the end of this report).
Based on data by Wool Statistical Area (WSA), the volumes of wool tested from July to November during 2024/25 decreased in all states (Figure 3). Western Australia had the greatest decrease in the volume of wool tested (down 18.1%), followed by Tasmania (down 16.2%), South Australia (down 11.9%), Queensland (down 6.0%), New South Wales (down 5.5%) and Victoria (down 4.5%).
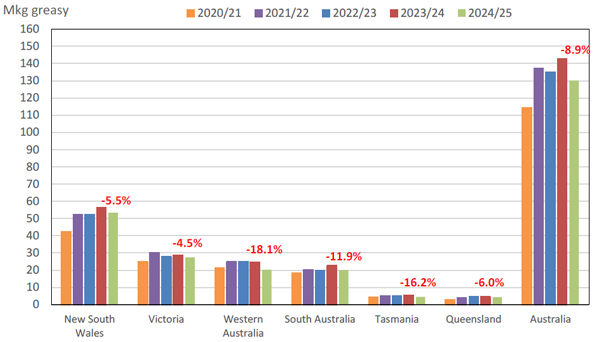
Figure 3: Volume of wool tested (AWTA WSA data) during the 2024/25 season from July to November compared with previous seasons (2020/21 to 2024/25). The percentage change in red font is the 2024/25 season from July to November compared with the same 5 months in the 2023/24 season.
In New South Wales, the greatest volumes of wool tested originated from WSA regions N23 (13.7%), N19 (7.4%), N03 (6.6%), N15 (6.5%) and N29 (6.2%) (Figure 4a). Collectively, these five WSAs represented 40.3% of the total weight of wool tested in New South Wales from July to November during 2024/25 (Figure 4b).
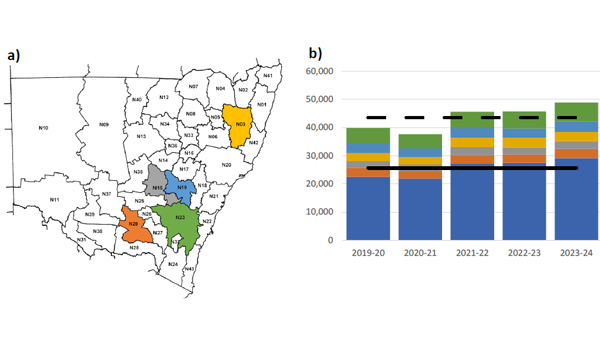
Figure 4: a) The five New South Wales WSA regions from which the greatest volumes of wool tested originated and b) The total wool test volumes for the 2024/25 season July to November compared with previous seasons (2019/20 to 2023/24). The larger blue portion of each column represents the other WSA regions with the coloured bars representing the 5 largest WSA regions: green; light blue; yellow; grey & orange. The continuous black horizontal line represents the 5-year average from 2019/20 to 2023/24 for the other WSAs with the dashed black line the five-year average for the state. Data is in greasy tonnes.
In Victoria, the greatest volumes of wool tested originated from WSA regions V07 (13.5%), V18 (12.9%), V22 (9.6%), V21 (8.6%) and V05 (8.5%) (Figure 5a). Collectively, these five WSAs represented 53.2% of the total weight of wool tested in Victoria from July to November during 2024/25 (Figure 5b).
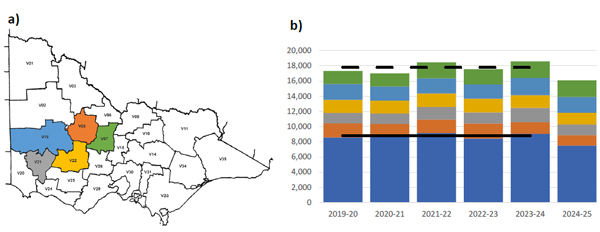
Figure 5: a) The five Victorian WSA regions from which the greatest volumes of wool tested originated and b) The total wool test volumes for the 2024/25 season July to November compared with previous seasons (2019/20 to 2023/24). The larger blue portion of each column represents the other WSA regions with the coloured bars representing the 5 largest WSA regions: green; light blue; yellow; grey & orange. The continuous black horizontal line represents the 5-year average from 2019/20 to 2023/24 for the other WSAs with the dashed black line the five-year average for the state. Data is in greasy tonnes.
In Western Australia, the greatest volumes of wool tested originated from WSA regions W12 (17.5%), W09 (16.7%), W10 (11.4%), W08 (9.2%) and W11 (9.0%) (Figure 6a). Collectively, these five WSAs represented 63.9% of the total weight of wool tested in Western Australia from July to November during 2024/25 (Figure 6b).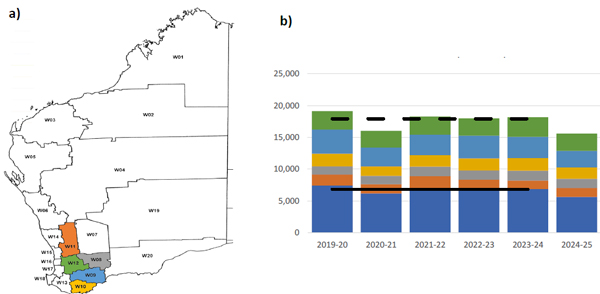
Figure 6: a) The five Western Australian WSA regions from which the greatest volumes of wool tested originated and b) The total wool test volumes for the 2024/25 season July to November compared with previous seasons (2019/20 to 2023/24). The larger blue portion of each column represents the other WSA regions with the coloured bars representing the 5 largest WSA regions: green; light blue; yellow; grey & orange. The continuous black horizontal line represents the 5-year average from 2019/20 to 2023/24 for the other WSAs with the dashed black line the five-year average for the state. Data is in greasy tonnes.
In South Australia, the greatest volumes of wool tested originated from WSA regions S29 (17.8%), S13 (10.4%), S15 (9.0%), S30 (5.6%) and S28 (5.0%) (Figure 7a). Collectively, these five WSAs represented 47.9% of the total weight of wool tested in South Australia from July to November during 2024/25 (Figure 7b).
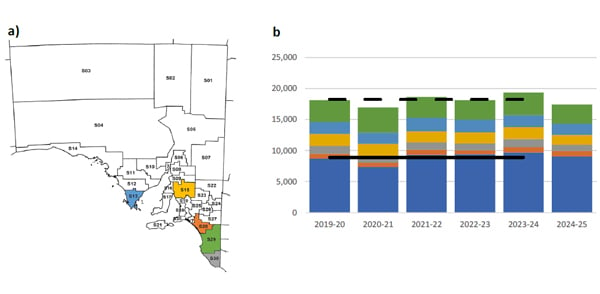
Figure 7: a) The five South Australian WSA regions from which the greatest volumes of wool tested originated and b) The total wool test volumes for the 2024/25 season July to November compared with previous seasons (2019/20 to 2023/24). The larger blue portion of each column represents the other WSA regions with the coloured bars representing the 5 largest WSA regions: green; light blue; yellow; grey & orange. The continuous black horizontal line represents the 5-year average from 2019/20 to 2023/24 for the other WSAs with the dashed black line the five-year average for the state. Data is in greasy tonnes.
In Tasmania, the greatest volumes of wool tested originated from WSA regions T05 (32.6%), T03 (32.5%), T04 (19.9%), T06 (11.8%) and T01 (3.1%) (Figure 8a). Collectively, these five WSAs represented 99.8% of the total weight of wool tested in Tasmania from July to November during 2024/25 (Figure 8b).
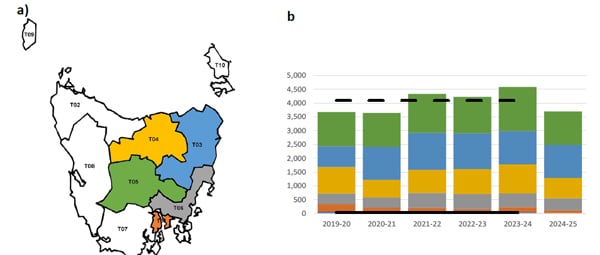
Figure 8: a) The five Tasmanian WSA regions from which the greatest volumes of wool tested originated and b) The total wool test volumes for the 2024/25 season July to November compared with previous seasons (2019/20 to 2023/24). The larger blue portion of each column represents the other WSA regions with the coloured bars representing the 5 largest WSA regions: green; light blue; yellow; grey & orange. The continuous black horizontal line represents the 5-year average from 2019/20 to 2023/24 for the other WSAs with the dashed black line the five-year average for the state. Data is in greasy tonnes.
In Queensland, the greatest volumes of wool tested originated from WSA regions Q12 (24.1%), Q15 (12.7%), Q23 (8.5%), Q17 (7.6%) and Q14 (6.6%) (Figure 9a). Collectively, these five WSAs represented 59.5% of the total weight of wool tested in Queensland from July to November during 2024/25 (Figure 9b).
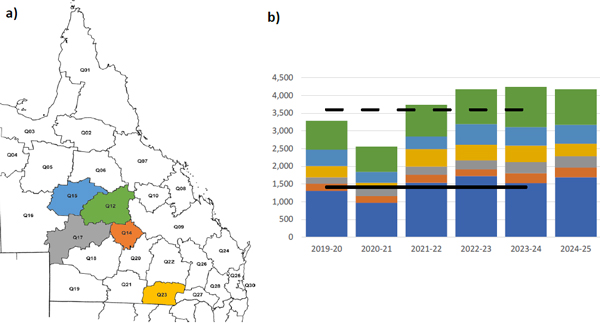
Figure 9: a) The five Queensland WSA regions from which the greatest volumes of wool tested originated and b) The total wool test volumes for the 2024/25 season July to November compared with previous seasons (2019/20 to 2023/24). The larger blue portion of each column represents the other WSA regions with the coloured bars representing the 5 largest WSA regions: green; light blue; yellow; grey & orange. The continuous black horizontal line represents the 5-year average from 2019/20 to 2023/24 for the other WSAs with the dashed black line the five-year average for the state. Data is in greasy tonnes.
A graphical representation of the AWTA Key Test Data changes in mean fibre diameter (MFD), vegetable matter (VM), staple length (SL), yield (YIELD), staple strength (SS) and hauteur (TEAM 3 H) from the 2004/05 to the 2024/25 season July to November is shown in Figure 10. On each graph the red dot represents the mean value of each characteristic for the 2024/25 season July to November while the blue dot represents the mean for the 2023/24 season July to November. The values above the gauge on the left-hand side of each graph show the mean and standard deviation respectively for that characteristic from 2004/05 to 2024/25 July to November. Each coloured segment on the gauges represents one standard deviation with the mean at 12 o-clock (centre). For MFD, VM, SL, YIELD and SS, the mean and standard deviation are based on data from the 2004/05 season onwards. For TEAM 3 the mean and standard deviation are based on data from the 2006/07 season onwards. The red line on each gauge is the mean for the 2024/25 season July to November (TY), while the blue line is the mean for the 2023/24 season July to November (LY).
- On a national basis, compared with the 2023/24 season July to November, mean fibre diameter was 20.1 microns down 0.3 micron, staple length was up 0.5 mm to 89.3 mm and staple strength was down 0.5 N/ktex to 34.7 N/ktex (Figure 10a).
- Vegetable matter was down 0.3% to 2.2%, yield was down 1.0% to 64.9% and predicted hauteur (TEAM 3) was up 0.8 mm to 71.2 mm (Figure 10b).
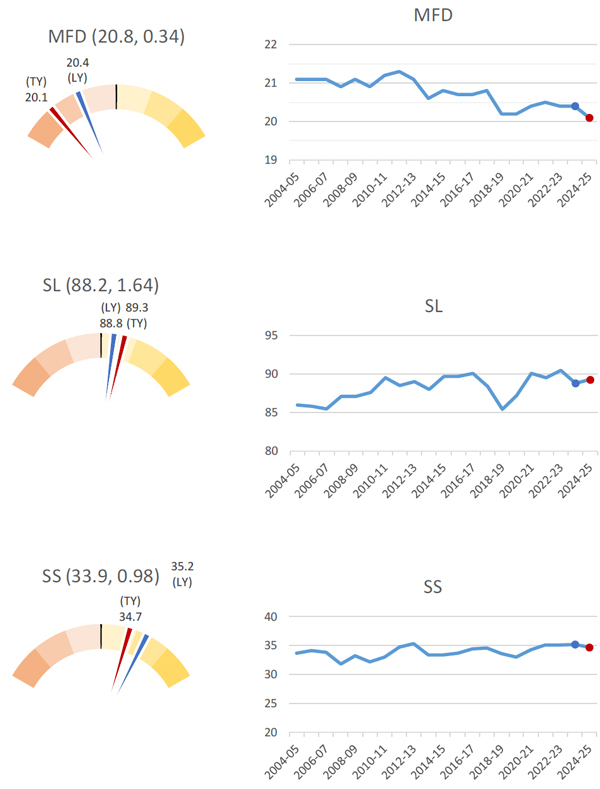
Figure 10a: AWTA Key Test Data (by sampling site) mean fibre diameter (MFD), staple length (SL) and staple strength (SS) for the Australian wool clip from 2004/05 to 2024/25 for July to November
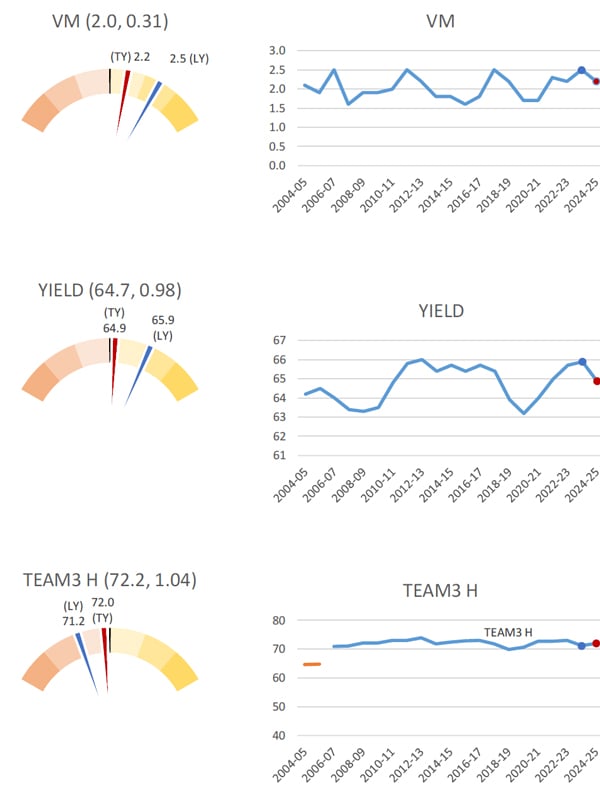
Figure 10b: AWTA Key Test Data (by sampling site) vegetable matter (VM), yield (YIELD) and TEAM 3 H (TEAM 3 H) for the Australian wool clip from 2004/05 to 2024/25 for July to November
AWEX auction statistics
The AWEX first-hand auction statistics for the 2024/25 to week 22 were 17.0% lower than the same time in 2023/24 (Table 5).
Table 5: AWEX First-hand Auction Statistics 2024/25 to week 22
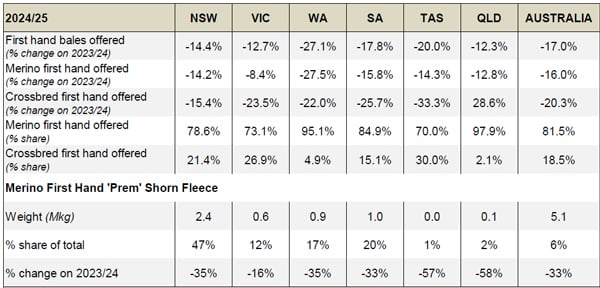
Note: Data on ‘prem shorn’ wool from AWEX is based on the assessed length of the wool being offered. it is defined as <85 - 75 mm, depending on micron and excluding weaners and lambs wool
- First-hand bales offered decreased in all states, Western Australia (down 27.1%), Tasmania (down 20.0%), South Australia (down 17.8%), New South Wales (down 14.4%), Victoria (down 12.7%) and Queensland (down 12.3%) (Table 5).
- The volume of first-hand Merino wool offered across Australia decreased by 16.0% with the volume of first-hand Crossbred wool offered down 20.3%. The share of Merino wool of all first-hand offered wool was 81.5 % in 2024/25 to week 22, compared with 80.7% in 2023/24 and 82.0% in 2022/23 for the corresponding sale weeks.
- There was a 33.0% decrease in the volume of ‘Prem-shorn’ Merino fleece wool in 2024/25 to week 22 (5.1 Mkg) compared with 2023/24 to week 22 (7.6 Mkg).
- As a percentage share of the total first-hand wool offered, 6% of Australian first-hand bales offered were prem shorn in 2024/25 to week 22. On a state-by-state basis this ranged from 1% in Tasmania to 47% in New South Wales.
Australian Bureau of Statistics (ABS) data
Sheep turn-off
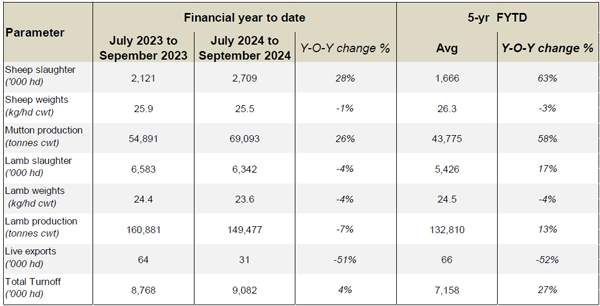
Australian sheep and lamb turn-off statistics during July to September 2024 are shown in Table 6:
- There was a 28% increase in sheep slaughter, and a 4% decrease in lamb slaughter compared with the same three months in 2023/24.
- Sheep slaughter was 63% above the five-year average with lamb slaughter 17% higher than the five-year average.
- The number of live sheep exported from Australia decreased by 51% between July to September 2024 and were 52% below the five-year average.
- Total turnoff of sheep and lambs between July and September 2024 was 4% higher than the same three months in 2023/24 and 27% above the five-year average.
Table 6: ABS Sheep turn-off data for 2024/25 to September 2024 compared with 2023/24 to September 2023
Bureau of Meteorology (BoM) seasonal rainfall seasonal outlook
Seasonal conditions during the 2024/25 were average to below average in the key wool producing regions in Western Australia, South Australia, Victoria and Tasmania (Figure 11). The major wool producing regions in South Australia and Victoria had very much below average to lowest on record rainfall deciles. The main wool producing regions in New South Wales and Queensland received average rainfall.
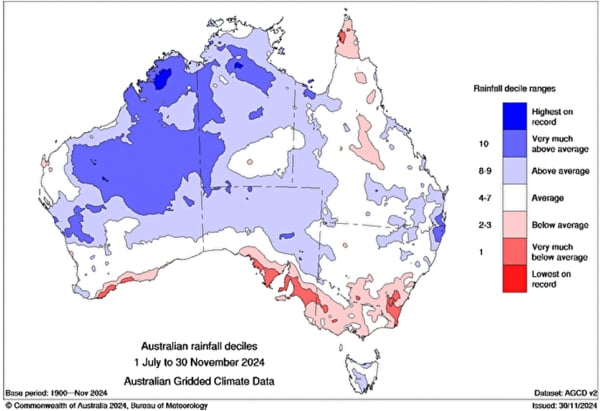
Figure 11: Australian rainfall deciles, 2024/25 season July to November
The landscape water balance in the major wool producing regions reflects seasonal conditions and rainfall (Figure 12).
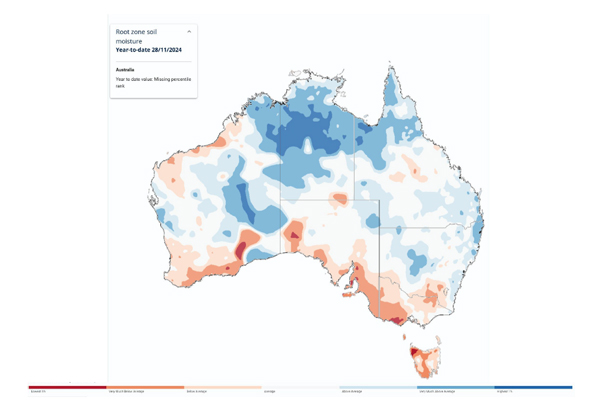
Figure 12: Australian landscape water balance, at 28 November 2024 (Source: Bureau of Meterology)
The Bureau of Meteorology’s outlook for January to March 2025 is for rainfall to be within the median to above the median range for most of the country (Figure 13). Rainfall is likely (60 to 80% chance) to be above average for much of eastern Australia, including eastern Tasmania, much of Queensland, NSW and Victoria; and large parts of SA and WA. Above average median maximum temperatures are likely to very likely (60 to greater than 80% chance) for most of Australia (Figure 14).
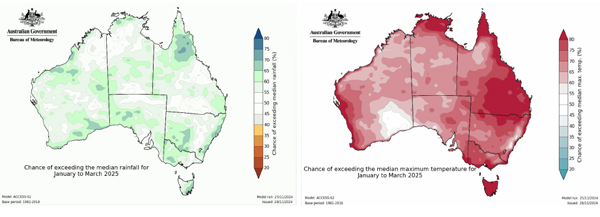
Figure 13 (Left): Chance of exceeding median median rainfall (Jan – Mar 2025) | Figure 14 (right): Chance of exceeding maximum temperature (Jan – Mar 2025)
In its update on 26 November 2024, the Bureau noted that the El Niño – Southern Oscillation (ENSO) remains neutral. The ENSO Outlook remains at La Niña watch.
Results from the MLA and AWI Sheep Producers Intentions Survey
The MLA and AWI Sheep Producers Intentions Survey – October 2024 indicated producer outlook for the wool sector remains subdued, down 4 points to a net sentiment of -19. Almost twice as many producers now have a negative outlook (36%) than a positive outlook (17%) regarding the wool industry. The outlook for the sheepmeat sector was more positive at +42 points compared to sentiment in October 2023 (-42 points). Producer sentiment in Western Australia remains significantly lower for both the wool and sheepmeat industries than other states.
Input costs, price volatility for lambs and wool, seasonal conditions, and availability of labour are the key factors impacting on-farm decision making.
Nationally, 40% of sheep producers intend to increase their lamb flock from 2024 to 2025, with 39% intending to decrease.
State Committee input
The following provides a summary of seasonal conditions and the wool production forecast for 2024/25 as reported by the AWPFC state committees in December 2024.
New South Wales
Generally good growing conditions for wool in New South Wales. Widespread rainfall fell across New South Wales in the last week of November, although some pockets of the state (i.e. the Monaro) remain quite dry. The Riverina was dry for a long time, which depleted soil moisture, with conditions expected to remain tight for a few months due to low subsoil moisture with sheep continuing to be fed. The November rain will change the summer feed program, reducing the value of crop stubble but boosting improved pastures (i.e. lucerne) which had been under pressure. The grazing outlook has improved, boosting the confidence of producers to hold numbers and potentially increase joining numbers for 2025.
Sheep condition is generally good across the state. Younger lambs are growing well, however marking and weaning percentages are variable. Wool cuts are expected to remain at 4.50 kg, close to the long-term average for NSW (4.55 kg). It has been a good season for wool production with moderate vegetable matter levels. Shearer availability is good, with shearing generally on time to the end of November. Shearing delays in 2023/24 meant 10 to 11 months growth in many current season clips rather than the full 12-months. Despite this staple length has increased by 2 mm compared with 2023/24 as stock have done well on the available feed. A decrease in prem shorn wools (due to high shearing cost) also contributed.
Negative sentiment remains regarding wool production due to low wool prices and increasing costs of production, although the latter also applies to all agricultural inputs. The relatively high cost of shearing relative to wool prices remains a key concern. Access to labour in western regions continues to be difficult. The additional cost of eID tags has prompted some producers to reduce numbers. Producers growing broader wools (where the prices have been similar for the past few seasons) are focussed on the cost of production, while finer wool growers are focused on low prices as current prices for finer wools have come off a high basis. The consensus is that the wool market will need to rise soon for Merino producers to retain numbers. Some Merino flock dispersals have occurred.
Spring ram sales were generally positive for all breeds, including Merino, Border Leicester andPoll Dorset. Merino ram sales had high clearance rates and strong averages despite the negative wool industry sentiment. Producers are changing their bloodline source to boost wool cut per head while maintaining quality to improve returns. There may have been reduced spending on rams in previous years with fewer rams purchased generating an increased replacement of ram teams in 2024. Improved fat lamb prices have prompted an increased intention to mate a proportion of the Merino ewe flock to a terminal sire to boost income. This will have an impact on sheep shorn numbers in 2025.
Low wool stocks held in brokers stores with some brokers report levels approximately 60% lower than the same time last season, although this does vary with region and wool type. Growers were motivated to sell wool in 2023 when livestock prices were very low. Cash flow has been bolstered in 2024 by higher livestock prices and sale of stored hay or grain. The New South Wales Committee’s third forecast of shorn wool production for 2024/25 is 110.5 Mkg greasy, down 7.5% on 2023/24.
Victoria
The poor conditions prevalent in August have continued through spring into early summer, particularly in the key wool producing regions (V18, V21 and V22). The dry spring has prompted producers to reduce sheep numbers. Cattle numbers have been maintained due to their relatively low value. The impact of recent rainfall on pasture feed availability remains to be seen and will depend on follow up rain and summer temperatures over summer. Dam water supply is a significant issue in many regions, producers are prepared to feed sheep but not cart water.
In some regions, failed crops will provide plenty of feed hay, in others (northeast and central) downgraded grain will be available for supplementary sheep feed, although a lower amount of hay was cut and stored. In the northwest, producers have grazed crops and hay paddocks with bare paddocks the result. While recent rain will provide some herbage coverage in paddocks, pastures will remain poor and not be sufficient to sustain sheep.
Shearing contractors report 10 to 20% fewer sheep being shorn. Ewe condition is likely to be less than optimal leading up to joining in 2025. Excellent seasonal conditions leading up to the 2024 joining produced high reproduction rates with many ewes bearing twins. Ewes have lost condition from rearing twins which will result in lower conception rates at their next joining. The poor spring has given them no means to improve condition. In the southwest, poor ewe lamb growth rates will reduce their subsequent first joining and reproductive potential.
Merino numbers are being reduced, flocks are being dispersed or transitioned to prime lambs. Any scanned dry ewes were sold. For scanned pregnant ewes there was an increase in prime lamb and crossbred matings and fewer pure Merino matings. Producers are looking for summer rain to hold current numbers. The next three months will be telling in terms of retained sheep and wool production.
Shearing is approximately 3 to 4 weeks ahead of schedule due to the dry conditions. The peak shearing period was August. Poor wool prices and increased costs are not conductive to increased wool production. Structural changes in the sheep industry and the move away from Merino production will have significant impacts through to the 2025/26 season. A lot of older sheep with higher wool cuts have been sold to slaughter and often not shorn prior to sale due to high shearing costs.
The dry season has maintained greasy per head production due to increased dust and contaminants. The Victorian Committee’s third forecast of shorn wool production for 2024/25 is 55.9 Mkg greasy, down 14.8% on 2023/24.
Western Australia
Crop yields are high across the state, although some sprouted grain from rain during harvest will reduce prices and increase availability of sheep feed. Some minimal input cropping systems are generating reasonable yields. Better than anticipated harvest in some regions will mean additional stubble available for sheep production over summer. Similarly, some regions have grown good feed crops and rebuilt hay and silage supplies. Mixed seasonal conditions in northern regions since spring. Tight seasonal conditions throughout most key wool producing regions, some areas are about average while others are poor. Concerns in some areas regarding on-farm stock water supplies for summer.
Producers continue to exit the industry, either dispersing entire flocks, cutting back on mobs or decreasing mob size. A few reports of flock increases with a view to capitalising on low sheep numbers. Wether lambs that would previously been kept to 12 to 18 months of age and shorn once or twice are no longer in the system.
Sheep condition is reported to be good with fleece weights expected to be stable. Younger ewes and lambs are being sold without shearing, some of the former are carrying between 2 to 8 months of wool growth. Some lamb feed lotters are shearing but stockpiling the wool until prices improve. Older ewes (4- to 5-year-old) have been sold in the wool and shipped interstate. Significant numbers of sheep (20%) and lambs (80%) were trucked interstate (62,768 from July to October, with 34,647 in October alone). A further 30,000 were transported in early November.
Most producers are selling their clip within 6 weeks of shearing. Some wool is being held on farm with some tested and held in broker’s store waiting for a price rise.
The Committee believed that the October 2024 Sheep Producer Intentions Survey grower sentiment for Western Australia was conservative, it is worse on the ground and will take significant change to turn it around. Stock agents are fielding increasing enquiries from producers regarding flock disposal sales. Renewable energy projects are displacing some sheep flocks as they guarantee significant per hectare returns for 20 years. Abattoirs continue to process 6,000 to 6,500 head per week.
Ram sales via the public auction system declined by 9% from 2023 with all ram breed groups impacted. Merino rams declined by 13% but made up 53% of ram sales (55% in 2023). British breeds comprise 33% of ram sales in 2024 (30% in 2023) with shedding breeds 8%. The percentage of shedding breeds is estimated at 20% of the Western Australian flock.
Mulesing contractors report 30% decreases in volume, but an increased number of crossbred lambs (up 10 to 20%) at the expense of Merino lambs. The Committee expects 1 million fewer Merino hoggets in WA for joining in 2025, which represents between 4 to 5 Mkg greasy of lost wool production. Crossbred ewe lambs will not be joined in 2025 as these are being sold for slaughter. The decrease in replacement ewes, both Merino and crossbred, will have a significant negative impact on the WA flock in the 2025/26 and 2026/27 seasons. The Committee expects further 20 to 25% reduction in shorn wool production from Western Australia. The Western Australian Committee’s third forecast of shorn wool production for 2024/25 is 44.7 Mkg greasy, down 18.8% on 2023/24.
South Australia
The pastoral regions received good rains in late November and early December. Prior to that it had been very dry but that did follow a couple of good seasons. The northwest pastoral region had two good rain events during November. Some northeast pastoral properties have changed to Dorpers. The season in the inside country ranges from poor to reasonable and carries the bulk of the South Australian sheep flock. Conditions in the poorer regions have been described as the worst ever. Some producers in the southeast haven’t experienced conditions like this previously. Numbers are down significantly with limited options to rebuild. The west coast is also poor, but producers are currently focused on harvest.
There is some positivity in the southeast region with some movement toward sheep at the expense of cattle due to low cattle prices. The poor autumn reduced yields and micron (down 1 to 2 μm), some wool cuts are back 1 kg. A large proportion (95%) of crossbred lambs are being sold in the wool due to the high cost of shearing. Fewer producers are shearing twice-yearly, many are moving to an annual shearing for the first time in 10 to 15 years. Producers are unsure whether they will shear in Autumn or carry their fleece through for a full 12 months.
The cost of land on the Yorke Peninsula is high, with the return on assets from pulse crops relative to other options is prompting sheep producers to change enterprises to cropping (pulses and lentils). Generational change is underway in the Eyre Peninsula, sheep enterprises are viable but not as profitable as previously. Cropping enterprises are expanding on the back of higher grain prices. The Mallee is tough with lower crop yields negatively impacting cash flows. Sheep are being managed in containment but at very high cost.
The dry conditions in Victoria have affected South Australian sheep producers by limiting potential restocker sales and processing capacity. Increased numbers of Merino flock disposals at sheep sales throughout the state with high numbers of young and old ewes are being sold for slaughter. Merino producers are switching to meat sheep due to high input costs and low wool prices. Reports of feed lotters improving their yards to contain Dorpers for purchase and fattening due to low availability of Merino lambs.
Few clips are being held long term prior to sale. Producers are selling to generate some cash flow. Average cut per head is expected to reduce due to the poor season. The South Australian Committee’s third forecast of shorn wool production for 2024/5 is 50.3 Mkg greasy, down 13.3% on 2023/24.
Tasmania
The season has been average. Although some regions, Southern Midlands, have had a better season than last year. Recent rains won’t have a significant impact on production. The reduction in sheep numbers occurred prior to the August meeting, with relatively stable numbers in the last four months. Most of the year’s wool production is on the sheep now with shearing progressing in many areas.
Sheep are in good condition and generally healthy with wool cuts expected to be average.
Producer sentiment in Tasmania is tough with many producers questioning their continued involvement in the wool industry. Cost of production is a key issue, all inputs including animal health treatments are rising which is reducing the margins for wool production. While no significant change is expected in the short term, a lift in wool prices is required in the medium term to give producers the confidence to join their usual number of Merino ewes in autumn. There is talk about a transition to cattle from sheep, but no large shift has occurred to date. The Tasmanian Committee’s third forecast of shorn wool production for 2024/25 is 8.3 Mkg greasy, down 10.8% on 2023/24.
Queensland
The season remains patchy. Many regions have had a lean winter, but there is a reasonable body of feed, albeit low in protein, in many areas. Recent rain will set these regions up for summer. Lambing percentages have been relatively low with sheep in a backward store condition due to low protein feed. Ewes may not regain lost condition which will negatively impact on their next joining, unless the 2025 joining window is pushed back. If there is no break by February, producers may choose not to join. Some producers have been supplementary feeding their flocks since April.
Sentiment remains poor for both wool and sheepmeat production. Shearing and transport costs to sale are each taking 30% of returns from wool and lamb sales. Longer transport distances (600 to 700 km) for sheep sales are driving up transport costs. Staff availability continues to be an issue and has prompted many producers to move from 6-monthly shearing back to a 12-month shearing schedule. There are few positives for sheep and wool production in Queensland. Merino flock disposals continue with a move to shedding breeds or away from sheep due to succession planning and retirement. Cattle numbers are holding.
Shearing contractors reports significant reductions in requests for their services in some regions. There is little to no demand for older ewes from restockers and less demand for wether lambs from southern states. Lamb mobs have significant variation in liveweight and growth rates and are typically being shorn about a month younger due to delayed joining in 2024 (because of heat). Producers are not tipping lambs due to the cost of shearing and are running their lambs fleece through to a longer length.
The 0.5 micron reduction in mean fibre diameter reflects the consistently tough season. Feed quality has declined steadily as the season progressed and impacted fibre diameter without changing staple strength. Plenty of clips are 1 micron finer than last year. Some producers didn’t join and ran their ewes as dry sheep, this along with held over weaned lambs contributed to the longer staple length. The overall younger age of the state’s flocks prompted the Committee to slightly reduce the average cut per head to 3.65 kg greasy.
Brokers report fewer held stocks due to sell down in 2023/24, with approximately 8% of last year’s clip still on farm and yet to come into store for testing. The Queensland Committee’s third forecast of shorn wool production for 2024/25 is 9.7 Mkg greasy, down 4.0% on 2023/24.
Appendix
Table A1: Comparison of shorn wool production in 2023/24 against the 2022/23 season and the third forecast for 2024/25 against the 2023/24 season
At their September 2022 meeting, the AWPFC National Committee resolved to include a clean estimate of shorn wool production based on the yield (%, Schlumberger dry top and noil yield) from the AWTA key test data for each complete season.
Note: Totals may not add due to rounding
Historical Australian Production Figures
The tables below provide historical sheep shorn numbers, wool production, fleece weight and micron share statistics since 1991/92 for background information.
Table A2: Australian wool production statistics since 1991/92
At their September 2022 meeting, the AWPFC National Committee resolved to include a clean estimate of shorn wool production for each full season based on the yield (%, Schlumberger dry top and noil yield) from the AWTA key test data for that season.
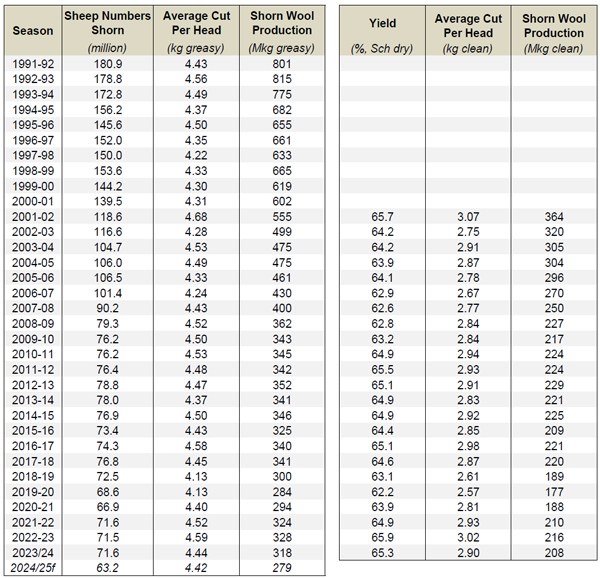
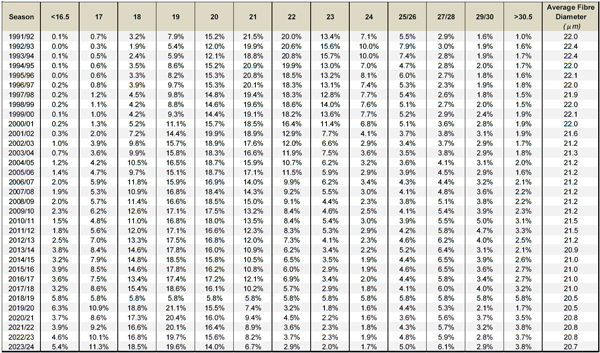
Table A3: Australian micron profile of AWTA wool test volume statistics since 1991/92 (% share and average micron)
Explanation of revised AWPFC data series
At the December 2005 meeting, the National Committee made the decision to collate and review the key variables (shorn wool production, cut per head, number of sheep shorn) used in the committee from the available industry sources and to create a consistent historical data series at both a state and national level. This was required as some differences existed between industry accepted figures and the AWPFC data series and to ensure a consistent methodology over time. This process resulted in changes to the parameters ‘average cut per head’ and the ‘number of sheep shorn’ for some seasons at both a state and national level.
Modus operandi for the Australian Wool Production Forecasting Committee
The Australian Wool Production Forecasting Committee draws together a range of objective data and qualitative information to produce consensus-based, authoritative forecasts four times a year for Australian wool production.
The Committee has a two-level structure, with a National Committee considering information and advice from state committees. It is funded by Australian Wool Innovation Limited, which also provides a representative in the role of the Chairman of the National Committee.
The National and state committees comprise wool producers, wool brokers, exporters, processors, private treaty merchants, AWEX, AWTA, ABARES, ABS, MLA, state departments of Agriculture, sheep pregnancy scanners and AWI.
The Committee releases its forecasts in the forms of a press release and a report providing the detailed forecasts, historical data and commentary on the key drivers of the forecasts.