Market intelligence report
This edition we look at global wool production, alternative fibres, and Australian wool production by volume and micron category.
Global wool production
Figure 1: Global wool production in billion kg greasy 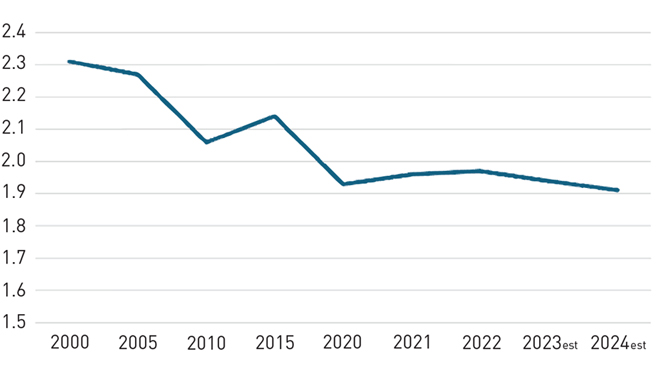
There is predicted to be a decline in wool production not just in in Australia but also in many of the other significant wool producing countries including South Africa, Argentina, New Zealand and the UK. Global wool production is forecast to decline by 2% in the coming year, with Merino wool production the most affected.
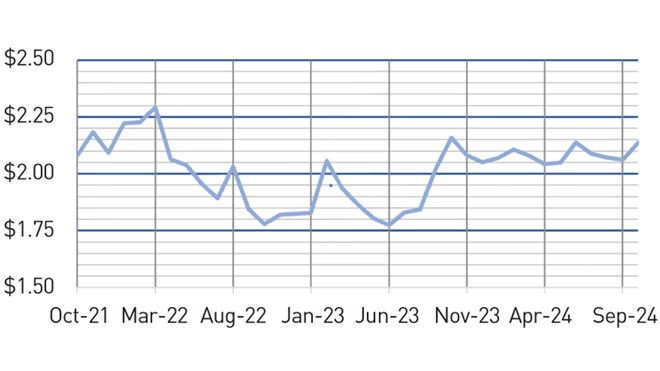
The low prices that crossbred wool has attracted over many years has led to innovation in non-traditional markets interested in using this wool type. Also, crossbred wool has begun to replace synthetics in many areas of the interiors market. In particular, bedding and carpet manufacturers are reverting to 100% wool product as the price for nylon continues to be less affordable and as consumers look for value and perceived natural benefits.
The volume of wool used in apparel has continued to fall below the volume of wool used in interior textiles. Farmers globally are increasingly choosing production systems with dual-purpose (wool plus meat) and prime lamb sheep breeds, as well as shedding breeds to completely avoid harvesting costs. This is particularly the case in Australia and New Zealand where harvesting costs are much more expensive in than other wool producing nations.
For the 2023/24 year, the gap between apparel wool and interiors wool is getting higher, with interior wool production now about 55% of global wool production while apparel wool production at about 45%. For a few decades prior to 2007, the split favoured apparel over interiors and homewares.
Figure 2: Global wool production markets 2023/24
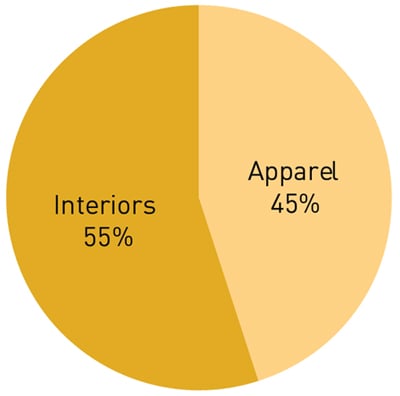
Figure 3: Raw wool price guide for Interiors (USD/kg clean)
Alternative fibres update
The past 12 months has seen the price of most of the extruded synthetic fibres and cotton alternatives to wool fall below the crossbred wool values.
Since the 2020 global pandemic, crossbred wools of 26 to 30 micron had been sitting underneath the values being paid for cotton, acrylic and polyester. Despite better gains for synthetics during the past six months, crossbred types have done enough cumulatively over the past year to stay above the value of synthetics and cotton as crossbred wool regains favour in the textile business.
Figure 4: Fibre prices in US dollars per tonne, November 2024
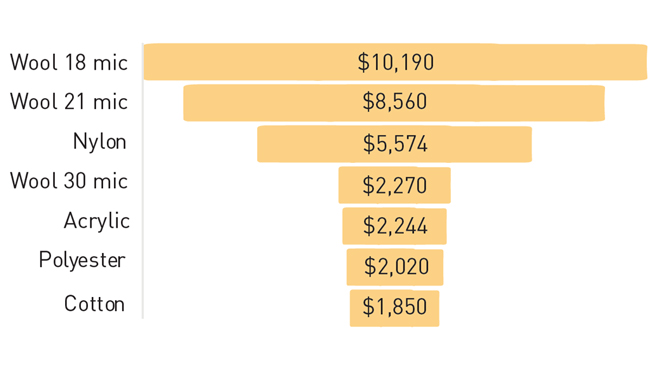
Merino wool values remain far more valuable and our medium Merino wool values are around the 3.5 to 4 times the price of acrylic, polyester and cotton, although the price gaps have narrowed in the past few decades.
The data since January 2024 shows values for synthetics slightly lower at around 1% less, while the two natural fibres wool and cotton are trending flat to down. Cotton has been particularly out of favour; its price having fallen 15.9% lower in just six months.
Australian wool production by volume: July to October 2024
The Australian Wool Testing Authority (AWTA) has tested 99.4 mkg (million kilograms) for the first third of the 2024/25 season (July to October). This is 7.7% down on last year at the same time.
Figure 5: AWTA Key Test Data by state
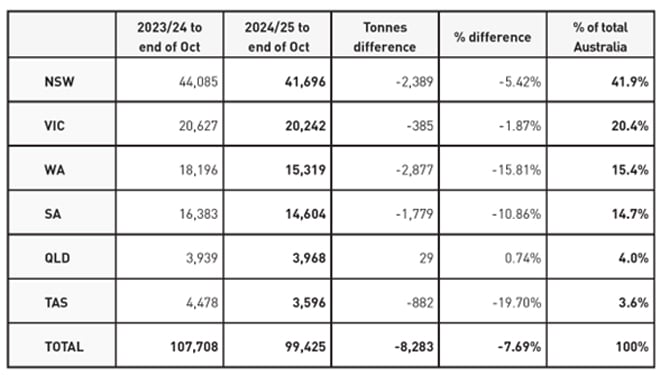
All states except Queensland have seen decreases. The biggest losses of production have been in drought-affected Tasmania which is down 19.7% compared to the end of October last year, and Western Australia which is down 15.8% compared to the end of October last year although it is an improvement on the 22.4% less that was recorded after last month’s AWTA report.
The two leading wool production states of NSW and Victoria (64.7% of national production) show losses that are restricted well below the forecast national fall in production for the year of 10.1%, helping hold up overall Australian volumes.
Australian wool production by micron category: July to October 2024
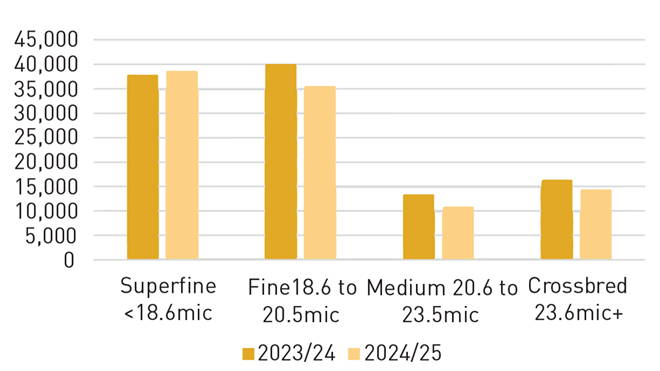
The first four months of testing by AWTA has produced some quite unexpected results. The only category to show increased production compared to the same period last year is the superfine Merino sector of 18.5 micron and finer, which has grown by 2.3% year on year by volume. Dry conditions may be a prime factor.
All other sectors have tested weights well in excess of the average national loss of 7.7%. Fine wools are 11.4% lower, medium wools down 19% and perhaps the most unexpected is the broadest and crossbred area of broader than 23.5micron which is 12.2% down compared to the same stage of last season.
Figure 6: Season to season by micron category for first four months of each season
AWI market intelligence for woolgrowers
In addition to this Market Intelligence Report provided each quarter in Beyond the Bale, AWI provides several other regular market intelligence services that are available FREE to woolgrowers, including:
Weekly Price Reports (during sale weeks), which include weekly EMI and WMI price movements, currency movements, the number of bales offered and sold, as well as weekly commentary from AWI on the markets.
Monthly Market Intelligence Reports that provide insights into economic, finance and trade issues affecting global demand for wool, and what this means for the Australian wool industry.
Graphical display of market information on Wool.com, including:
- Micron price – you can select from a full range of microns, sold in Sydney, Melbourne and Fremantle.
- Market Indicator – you can select to display AUD, USD, CNY or EUR.
- Offering – displays bales offered and bales sold.
- Currency movements – you can select to display AUD/USD, AUD/CNY or AUD/EUR.
- Forecast of bales sold – displays previous season, current season, current week and forecast.
For the first four categories above, you can select to display data from 3 months to 3 years ago.
Australian Wool Production Forecasting Committee reports that provide detailed estimates of sheep numbers, sheep shorn, average cut per head and wool production. The reports are produced three times each year.
Sheep Producer Intentions Survey which are conducted three times each year jointly with MLA. The survey results are used to create regional, state and national wool and sheepmeat industry data which enables the industry to better manage the supply chain and meet producer and customer expectations.
More information: View the above market intelligence information at www.wool.com/marketintel or subscribe at www.wool.com/subscribe to receive the information by email and/or SMS. You can unsubscribe from the service at any time.
This article appeared in the December 2024 edition of AWI’s Beyond the Bale magazine. Reproduction of the article is encouraged.


