Market intelligence report: Australian wool export destinations during the 2022/23 season

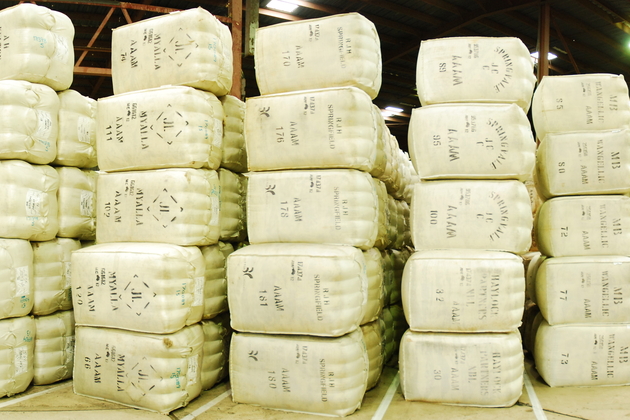
During the 12 months of the July 2022 to June 2023 season, a touch more than 325mkg of Australian wool was exported in all forms, with greasy wool the dominant form at 310.65mkg which represents 95.6% of all wool exports.
Scoured wool made up 1.4% of all wool exports and 3.0% was in the carbonised product, but as the ABS export data is on the processing weight, then both these figures would be slightly higher if measured in terms of their original greasy weight prior to local processing.
As far as greasy wool is concerned, 19 individual countries imported Australian raw wool during the year.
China remains firmly entrenched as Australia’s leading destination for its wool clip. For the year, China imported more than 82.5% of Australian wool by weight. This is an increase of 2.4% over the previous season. When value of exports is measured, China accounted for 78.8% of the clip value which is nearly 5% lower than the money they spent on wool imports the previous year.
Away from the dominant buyer that is China, India has accelerated its percentage buying share and volume of Australian wool by importing more than 6.5% of the national export by weight. This is an increase of 26.2% compared to 2021/22. Value wise, 6.4% of export value came from India which represented a spend of nearly 24% greater than last season.
Italy has dropped away by quite a bit in volume purchased and fell to 3.6% of all exports, which is an 11.7% drop in their wool purchasing by weight for the year. Italy’s contribution though for value made up 7% of export dollars, but is a figure 3.6% lower than 2021/22.
Analysis of the fibre micron distribution of exports highlights some popular misconceptions of key wool export destinations. Italy for example has more than 40% of its imports broader than 20 microns, whereas most people would think superfine types would make up a high majority. This Italian figure is perhaps slightly skewed broader than reality though because the Egypt figures could be almost entirely added to the Italy figures as most of the export to Mediterranean Wool is done so for the use of Italian shareholders.
The most significant drop in wool exports has come from the Czech Republic (Czechia). The past year has seen a reduction of 33.8% volume by weight imported from Australia and Czechia now accounts for just 2.6% of Australian exports of wool by weight. They are buying lower value raw material from Australia with just 1.66% of clip value now emanating from Czechia imports which is 36.5% less than the preceding 12 months. The Czechia figures show that more than 55% of the Czechia purchasing is between 24- and 33-micron.
Germany was a nation that had a large drop in imports, being 1mkg less than the previous 12 months. It is ‘normal procedure’ that wools destined for Russia and Belarus are mostly transhipped by road through Germany, and the prevailing conflict in Ukraine could therefore perhaps be responsible for the drop.
Vietnam joined the ranks as a direct buyer of Australian wool by directly importing more than 150 tonnes of carbonised product. All of this was in the Merino microns of finer than 23-micron with more than 50 tonnes being finer than 19-micron. It is most likely assumed this purchasing would almost entirely be for cotton spinning operations.
Cameroon was a surprise first time importer of Australian wool by taking 18 tonnes of 20- to 23-micron wool. On the processed side, 23 countries imported semi processed wool of commercial weight.

Table 1. All Australian wool export destinations in 2022/23, by weight (kg) and value
|
Country |
Weight |
% clip by weight |
% change in weight |
% clip by value |
% change in value |
|
China |
268,370,330 |
82.57% |
2.4% |
78.84% |
-4.9% |
|
India |
21,310,835 |
6.56% |
26.2% |
6.37% |
23.7% |
|
Italy |
11,812,901 |
3.63% |
-11.7% |
6.98% |
-3.6% |
|
Czech Republic |
8,434,428 |
2.59% |
-33.8% |
1.66% |
-36.5% |
|
Korea |
4,520,220 |
1.39% |
-10.7% |
1.57% |
-19.5% |
|
Egypt |
2,457,573 |
0.76% |
-8.0% |
1.04% |
-0.9% |
|
Thailand |
2,114,046 |
0.65% |
0.3% |
1.09% |
5.3% |
|
Germany |
953,237 |
0.29% |
-47.7% |
0.23% |
-44.1% |
|
Bulgaria |
905,661 |
0.28% |
7.3% |
0.23% |
1.0% |
|
Japan |
728,572 |
0.22% |
-4.2% |
0.68% |
132.6% |
|
United Kingdom |
685,405 |
0.21% |
-29.8% |
0.27% |
-29.7% |
|
United Arab Emirates |
566,490 |
0.17% |
-24.8% |
0.31% |
-28.1% |
|
USA |
511,040 |
0.16% |
5.7% |
0.14% |
-8.0% |
|
Turkey |
323,818 |
0.10% |
86.5% |
0.14% |
75.3% |
|
Uruguay |
236,295 |
0.07% |
-69.6% |
0.08% |
-65.4% |
|
Mexico |
210,149 |
0.06% |
-12.3% |
0.07% |
-7.3% |
|
South Africa |
164,130 |
0.05% |
113.0% |
0.07% |
6.8% |
|
Spain |
158,533 |
0.05% |
-1.1% |
0.04% |
-9.8% |
|
Vietnam |
152,080 |
0.05% |
|
0.04% |
|
|
Mauritius |
132,795 |
0.04% |
-46.7% |
0.05% |
-50.3% |
|
Lithuania |
79,442 |
0.02% |
-8.4% |
0.04% |
-8.3% |
|
New Zealand |
43,393 |
0.01% |
-73.6% |
0.01% |
-83.4% |
|
Pakistan |
38,465 |
0.01% |
0.7% |
0.01% |
-22.7% |
|
Malaysia |
37,146 |
0.01% |
-39.7% |
0.02% |
-10.2% |
|
Taiwan |
26,488 |
0.01% |
-55.9% |
0.01% |
-52.9% |
|
Portugal |
25,526 |
0.01% |
99.8% |
0.01% |
118.6% |
|
Cameroon |
18,256 |
0.01% |
|
0.01% |
|
|
Tunisia |
13,760 |
0.00% |
66.4% |
0.01% |
66.4% |
|
Singapore |
575 |
0.00% |
|
0.00% |
|
|
Sri Lanka |
180 |
0.00% |
|
0.00% |
|
|
TOTALS |
325,031,769 |
100% |
0.70% |
100% |
-4.4% |
Table 2. All Australian wool export destinations in 2022/23 in kg, by micron
|
Country |
<=19.0 |
20.0 - 23.0 |
24.0 - 27.0 |
>=28.0 |
Total |
|
China |
134,719,489 |
94,175,580 |
21,027,450 |
18,447,811 |
268,370,330 |
|
India |
5,375,330 |
12,371,442 |
1,639,871 |
1,924,192 |
21,310,835 |
|
Italy |
7,020,066 |
4,255,728 |
35,161 |
501,946 |
11,812,901 |
|
Czech Republic |
1,879,894 |
1,806,073 |
2,201,350 |
2,547,111 |
8,434,428 |
|
Korea |
1,690,358 |
2,829,862 |
|
|
4,520,220 |
|
Egypt |
2,076,898 |
380,675 |
|
|
2,457,573 |
|
Thailand |
637,308 |
1,476,738 |
|
|
2,114,046 |
|
Germany |
148,688 |
344,535 |
18,262 |
441,752 |
953,237 |
|
Bulgaria |
456,346 |
79,081 |
101,769 |
268,465 |
905,661 |
|
Japan |
284,961 |
443,591 |
|
20 |
728,572 |
|
United Kingdom |
61,103 |
533,243 |
|
91,059 |
685,405 |
|
United Arab Emirates |
|
566,490 |
|
|
566,490 |
|
USA |
|
100,177 |
|
410,863 |
511,040 |
|
Turkey |
98,689 |
110,561 |
|
114,568 |
323,818 |
|
Uruguay |
236,295 |
|
|
|
236,295 |
|
Mexico |
51,054 |
108,359 |
|
50,736 |
210,149 |
|
South Africa |
|
151,261 |
|
12,869 |
164,130 |
|
Spain |
64,350 |
|
|
94,183 |
158,533 |
|
Vietnam |
50,530 |
101,550 |
|
|
152,080 |
|
Mauritius |
63,875 |
68,920 |
|
|
132,795 |
|
Lithuania |
14,078 |
55,735 |
|
9,629 |
79,442 |
|
New Zealand |
4,415 |
38,119 |
|
859 |
43,393 |
|
Pakistan |
|
38,465 |
|
|
38,465 |
|
Malaysia |
19,673 |
17,473 |
|
|
37,146 |
|
Taiwan |
|
26,488 |
|
|
26,488 |
|
Portugal |
25,526 |
|
|
|
25,526 |
|
Cameroon |
|
18,256 |
|
|
18,256 |
|
Tunisia |
|
13,760 |
|
|
13,760 |
|
Singapore |
|
|
|
575 |
575 |
|
Sri Lanka |
|
|
|
180 |
180 |
|
Totals |
154,978,926 |
120,112,162 |
25,023,863 |
24,916,818 |
325,031,769 |
This article appeared in the September 2023 edition of AWI’s Beyond the Bale magazine. Reproduction of the article is encouraged.


