How well does early performance predict lifetime performance of MLP sires?
This article examines the effectiveness of current selection indexes in predicting lifetime sire performance at a young age and explores potential improvements to enhance their prediction accuracy.
One of the key focusses of the MLP project is to generate data that can be used to identify ways to better predict lifetime performance from an early age. Selection at an early age has many benefits from both a cost management and genetic progress perspective, but are they accurate enough? Industry utilises a range of tools to support breeding and selection decisions to make them as accurate as possible, so how can we best utilise them? In this article, we examine the effectiveness of current selection indexes in predicting lifetime sire performance at a young age and explore potential improvements to enhance their prediction accuracy.
This investigation features the Balmoral MLP site and explores the change in predicted sire performance over time using the Merino Production (MP), and the Merino Production Plus (MP+) indexes. Note that this study is exploring estimates of sire lifetime productivity via assessment of their progeny, which differs to looking at individual animal estimates of lifetime productivity. The use of the 2015 and 2016 drops allows us to investigate the impact of the age of assessment and volume of data on the prediction of sire lifetime performance. The indexes were generated from an analysis that included only the Balmoral data and is referred to as a ‘within flock’ analysis. Each drop was also analysed separately to each other, and without the inclusion of any genomic information.
In the project, the 2015 drop was shorn seven times and joined five times, while the 2016 drop was shorn six times and joined four times. To allow both drops to be directly compared, the 2015 drop’s sixth adult assessment and fifth reproduction event is not included in this investigation.
Through the life of the MLP project the analysis has undergone enhancements, including a change to the reproduction analysis. To allow the sire performance from each age stage to be directly compared, the Balmoral data was completely re-run using the latest analysis process as of February 2024.
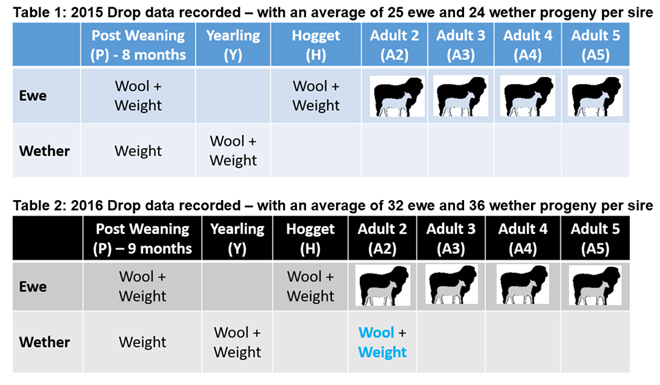
Looking at the data that made up the estimates of sire performance from the 2015 and 2016 drops (Tables 1 and 2), there were three key differences between the two drops:
- The 2016 drop had on average 20 more progeny per sire evaluated.
- There was more data available from wethers in the 2016 drop (shorn twice).
- The 25 sires in each drop were genetically different (except for the four link sires that are used in both drops).
At each year of assessment, animals had wool, growth, carcase, and worm egg count recorded (where possible), and from two years of age (Adult 2) reproduction performance was assessed.
In charts 1 to 4 we compare the 25 sires within flock index values progressively at each age stage, with the final or lifetime index value. We need to recognise that the MLP dataset is extensive, and has a highly diverse mix of sires, so the results shown are the best-case data recording and will exhibit a range in performance that you might not expect on your farm. Artificial insemination was used to generate the progeny of these sires, which means that age differences between animals in the flock are minimal, unlike differences seen in studs with a 5-week joining. It’s good to also keep in mind that generally breeding value and index users are using across flock breeding values (ASBVs) which often have the benefit of information from genomics at early ages.
The charts show sire index performance at each age stage using the following abbreviations:
P=Post Weaning, H=Hogget, A2=Adult2 (first adult shearing at approximately 2 years of age), A3=Adult3 (second adult shearing at approximately 3 years of age), A4=Adult4 (third adult shearing at approximately 4 years of age) and A5=Adult5 (fourth adult shearing at approximately 5 years of age).
Each age stage uses all the data prior to that point to generate the index performance, so for example the A2 value combines data from Y, H and A2, etc. We are reporting correlations between sires’ indexes at the different age stages and their lifetime performance (all data from P to A5). Correlations describe the level of relationship between attributes and range from 0 to 1, where 0 is no relationship and 1 is a perfect relationship.
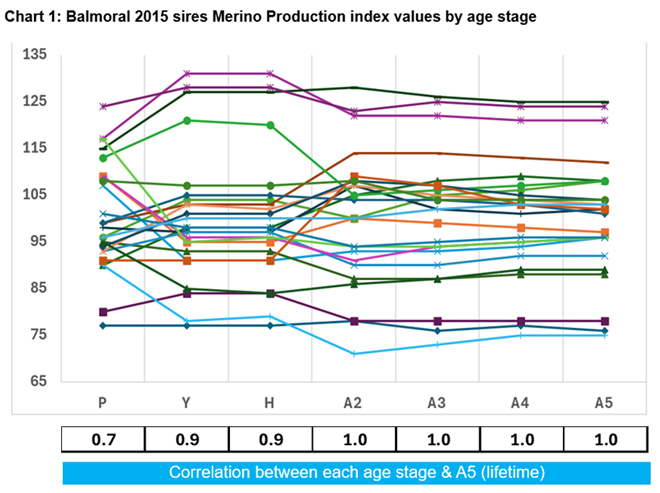
Chart 1 shows the MP within flock index values for sires used in the 2015 drop, comparing each age of assessment. The MP index is a balance of wool and surplus sheep sales with approximately equal emphasis on improvement in fleece weight and micron but does not include staple strength or reproduction.
When the sire’s performance was assessed based on the 2015 drop ewe progeny at Post Weaning age stage (P) there was a 0.7 correlation with the sires’ final MP lifetime index at A5. But once we added the wether data at yearling stage, the index correlation was 0.9 with the sires lifetime index value. It’s not until one adult fleece measurement (the third fleece assessment) was recorded at A2 that the index value predicted lifetime performance accurately (correlation of 1). We see some reranking in sire performance from P through to A2, but from A2 onwards, the sire’s rankings change minimally (i.e. the sire lines on the chart are less likely to cross).
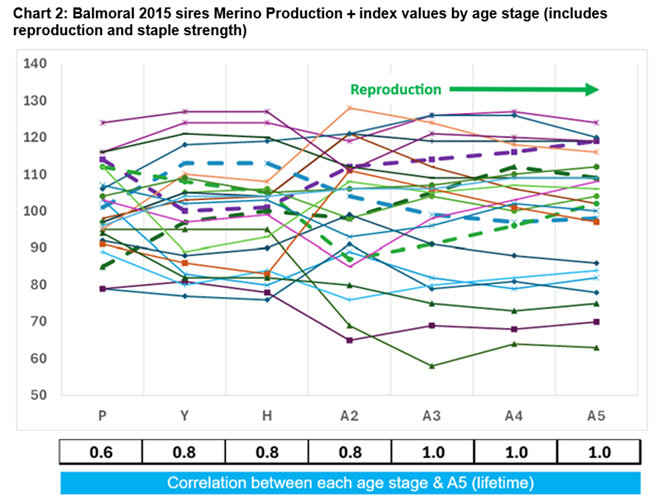
If we bring reproduction and staple strength measurements into the index calculation, which is the case in the MP+ index, we see a slightly different story (Chart 2). Like the MP index, sires on the MP+ index showed some reranking early on, but the introduction of one reproduction event had a significant effect on the sire rankings. The relationship between the age stage and the lifetime value was high at 0.8 but not 1 until we had two reproduction records at A3.
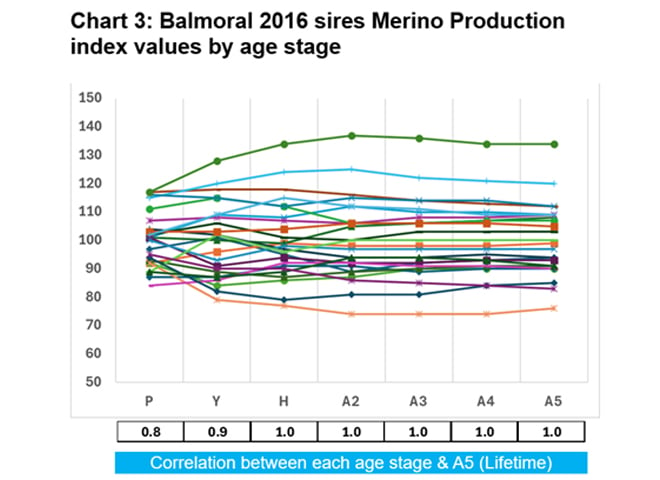
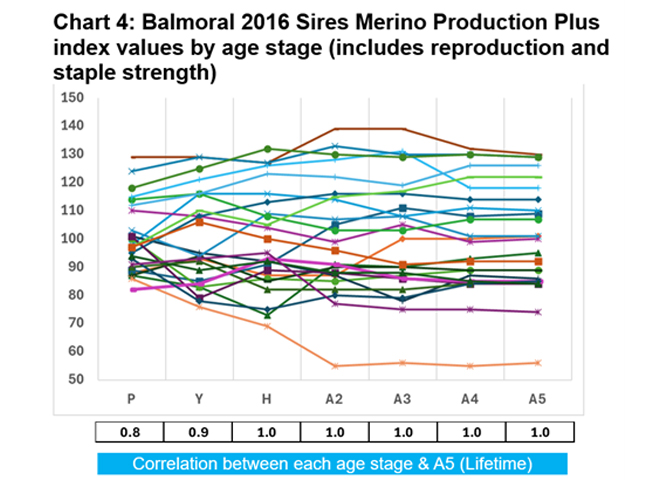
Looking at the 2016 drop, we see a similar story, although stronger correlations were estimated (chart 3 and 4). The extra progeny per sire and the increased number of assessments on the wethers helped with the predictions.
The correlations for individual animals followed a similar trend across the two drops, but were slightly lower than what was estimated for sires across all the ages (0.54 – 0.99).
As a team, the correlations between each age stage show that the sires from each drop had reasonable prediction of lifetime performance from early measurements, but certainly benefited from later stage fleece measurements and two reproduction events. This is comforting for commercial breeders who are using ram teams for joining.
If you were following sire performance (the lines over time) you will see that although overall the average relationship between performance at each age stage was good, there were individual sires that changed in rank over time. In Chart 2 in the 2015 drop, one sire ranked 14 out of 25 sires (purple dash line) at yearling and moved to rank 3 by the final index. Another was initially ranked 23 at yearling and moved to rank 8 (dark green dash line) by the final index. While in contrast, two other sires start at rank 5 and 8 (at yearling) and dropped to rank 17 and 14 (light blue and light green dash lines), respectively. Ram breeders should note that as they look closely at individuals to select potential sires, most will perform as predicted at a hogget age but a few won’t. It is why progeny testing with reasonable progeny numbers is important.
When we look at these four sires in more detail, the change in rank mostly relates to their performance for reproduction getting better or worse over time, although one sire’s performance decline was associated with a reduction in fleece production over time. The project will explore further the value of incorporating changes in fleece production over time (whether they increase or decrease) into genetic selection programs.
What we take away from this investigation using the MP and MP+ indexes is that measuring both ewes and ram progeny of a sire at an early age gives us a reasonable prediction of lifetime wool and growth performance, however, one additional hogget or adult measurement greatly improves a prediction of a sire’s lifetime performance. We also see that when more progeny are available for evaluation, and are evaluated more than once, the accuracy of prediction is better at an earlier age. For highly accurate predictions of a sire’s lifetime reproduction performance, generally two adult records are needed.
This work focuses on the index accuracy of sires involved in progeny testing. Following the recommendations from this investigation would result in sire breeding values reaching high accuracy once the sire himself is about 5 years of age. The next step for the MLP project is to look at what is needed to select sires more accurately for the progeny testing process. This research will be highlighted in upcoming editions of Beyond the Bale, along with an exploration of how accurately early sire breeding values predict later values at other MLP project sites.
MLP quick facts
The AWI-funded MLP project is a $13 million ($8million from AWI plus $5 million from project partners), 10-year venture between AWI, the Australian Merino Sire Evaluation Association (AMSEA), nominating stud Merino breeders and site partners.
- Balmoral, Vic
Partner: Tuloona Pastoral
Committee: Balmoral Breeders Association
- Pingelly, WA
Partner: Murdoch University / UWA
Committee: Federation of Performance Sheep Breeders (WA Branch)
- MerinoLink, Temora NSW
Partner: Moses & Son
Committee: MerinoLink Limited
- Macquarie, Trangie NSW
Partner: NSW DPI
Committee: Macquarie Sire Evaluation Association
- New England, NSW
Partner: CSIRO
Committee: New England Merino Sire Evaluation Association
The MLP project is tracking the lifetime performance of 5,700 ewes as they proceed through four to five joinings and annual shearings.
A full suite of assessments is being undertaken including visual trait scoring, classer gradings, objective assessments of a range of key traits and index evaluations.
A unique and extensive dataset will result and be used to enhance existing Merino breeding and selection strategies, for both ram sellers and buyers, to deliver greater lifetime productivity and woolgrower returns.
To stay up to date with the latest MLP findings, visit www.wool.com/MLP. Subscribe to MLP updates via www.merinosuperiorsires.com.au/contact-us
This article appeared in the June 2024 edition of AWI’s Beyond the Bale magazine. Reproduction of the article is encouraged.